No edit summary |
No edit summary |
||
| (One intermediate revision by the same user not shown) | |||
| Line 1: | Line 1: | ||
{{#tweekihide:firstHeading|sidebar-right}}{{#arraymap:Evidence,Vision,Action | {{#tweekihide:firstHeading|sidebar-right}} | ||
Welcome to the UNLOCK15-Toolbox - we are collecting tools to empower „agents of change“ from civil society as well as city officials to unlock existing lock-ins. We hope you will find some relevant tools to drive change towards mobility transition in your context! | |||
From experience, three types of tools are need for real change: tools to create and communicate evidence, tools to envision possible futures and scenarios and participatory tools for on-site action. | |||
{{#arraymap:Evidence,Vision,Action | |||
|, | |, | ||
|xxx | |xxx | ||
| Line 5: | Line 10: | ||
|links= | |links= | ||
|title=xxx | |title=xxx | ||
|query=[[semorg-toolbox-tool-type::xxx]] | |query=[[semorg-toolbox-tool-type::xxx]][[semorg-toolbox-visualisation::+]] | ||
|card template=toolbox | |card template=toolbox | ||
|nopagination | |nopagination | ||
|limit=3 | |limit=3 | ||
|order=rand | |order=rand | ||
}}[[xxx| | |intro=<div class="mb-2">{{xxx-intro}}</div> | ||
}}[[xxx|more tools for xxx…]] | |||
| | | | ||
}} | }} | ||
Latest revision as of 14:04, 19 May 2026
Welcome to the UNLOCK15-Toolbox - we are collecting tools to empower „agents of change“ from civil society as well as city officials to unlock existing lock-ins. We hope you will find some relevant tools to drive change towards mobility transition in your context!
From experience, three types of tools are need for real change: tools to create and communicate evidence, tools to envision possible futures and scenarios and participatory tools for on-site action.
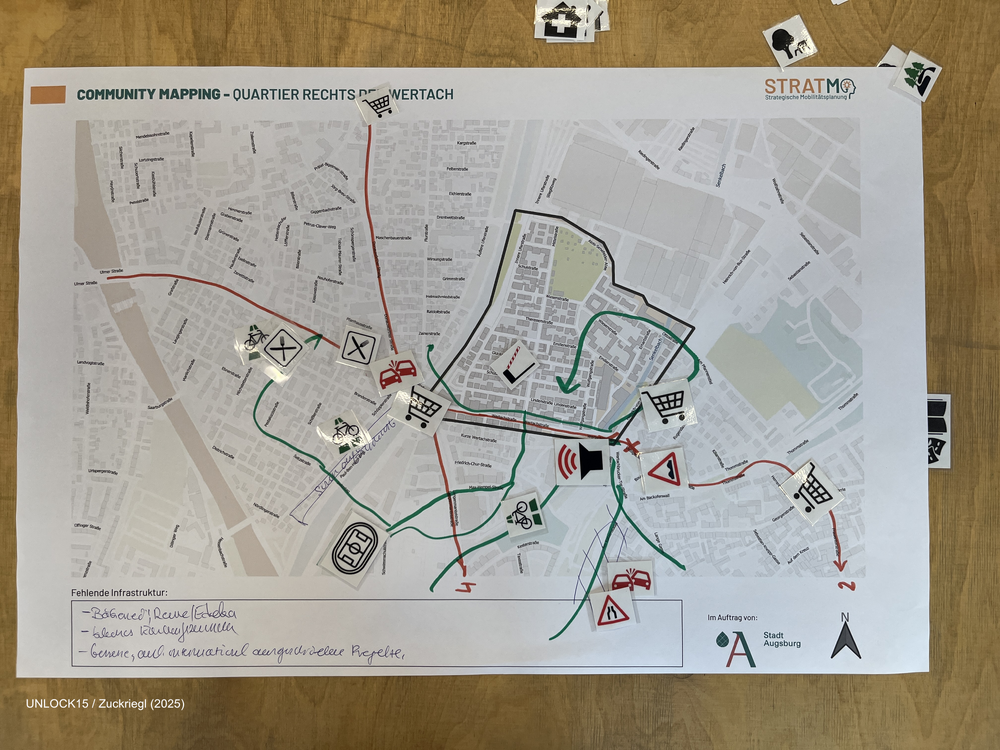
Community mapping
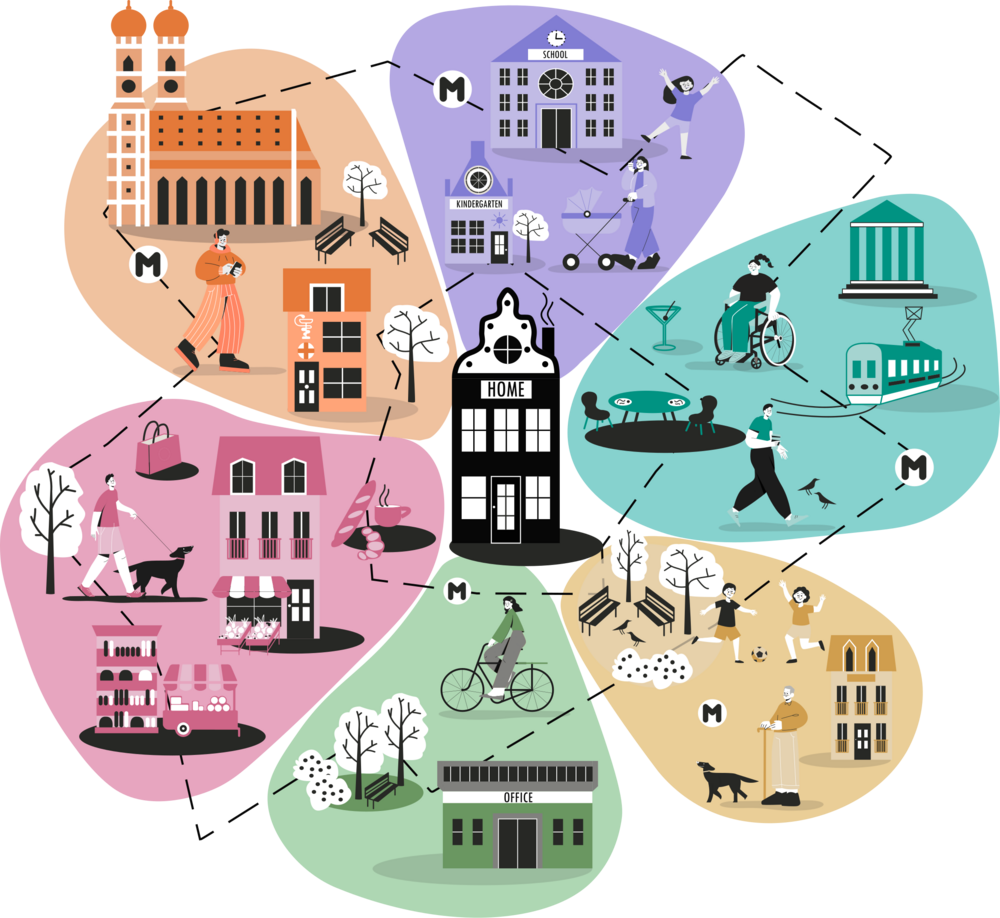
Measuring the 15-min city: Flowers of Proximity
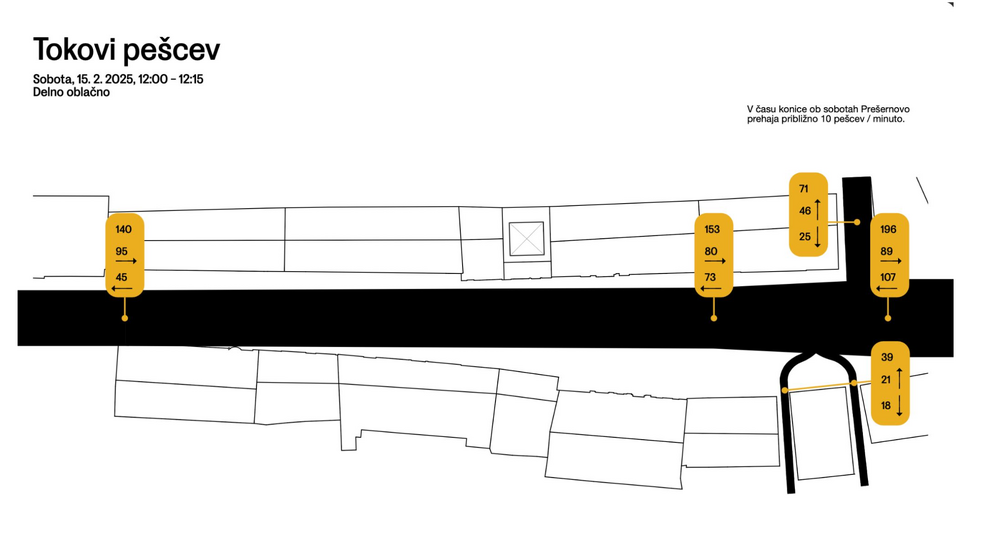
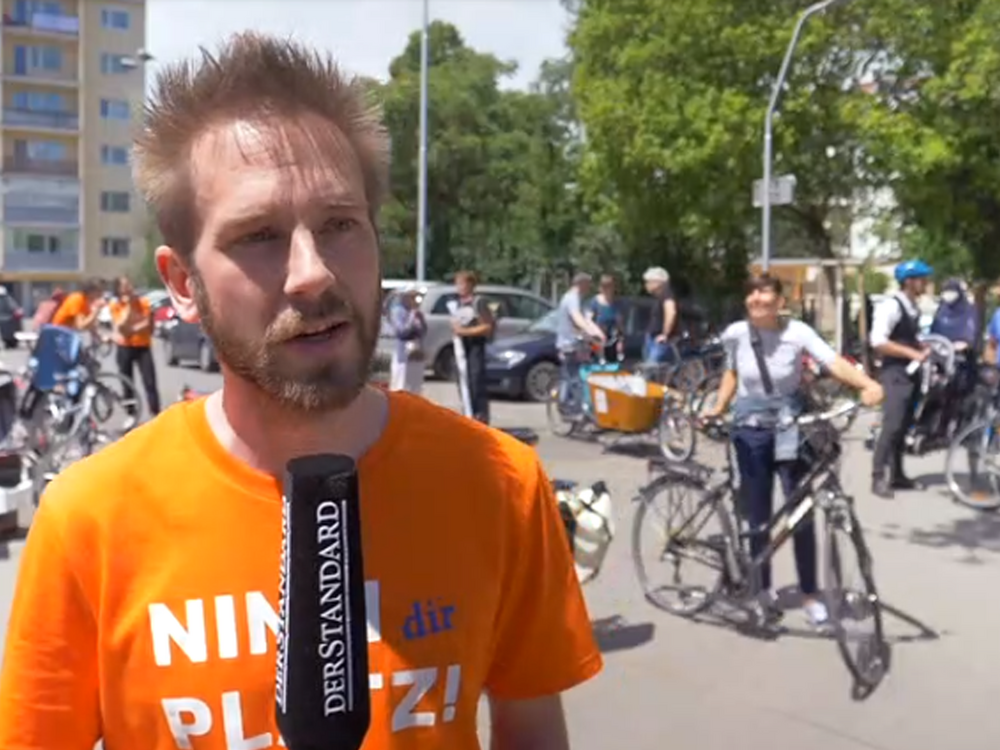
Observing and visualising human behaviour in public space

Onboarding framework
The Onboarding Framework is a structured yet flexible tool designed to help grassroots civil society initiatives welcome and integrate new volunteers with as little friction as possible.
The framework helps initiatives answer three core questions: What does a new volunteer need to know, feel, and do to get started? Where do their skills and interests fit best? And how can the organization make that first step feel easy, welcoming, and worthwhile?
By providing a clear path from curiosity to commitment, the Onboarding Framework reduces dropout at the earliest stage, builds a sense of belonging from day one, and ensures that volunteer energy is channeled effectively — strengthening the initiative's capacity from the bottom up.
Building durable groups with low hierachies

Make your city bloom! Before/After Visualization
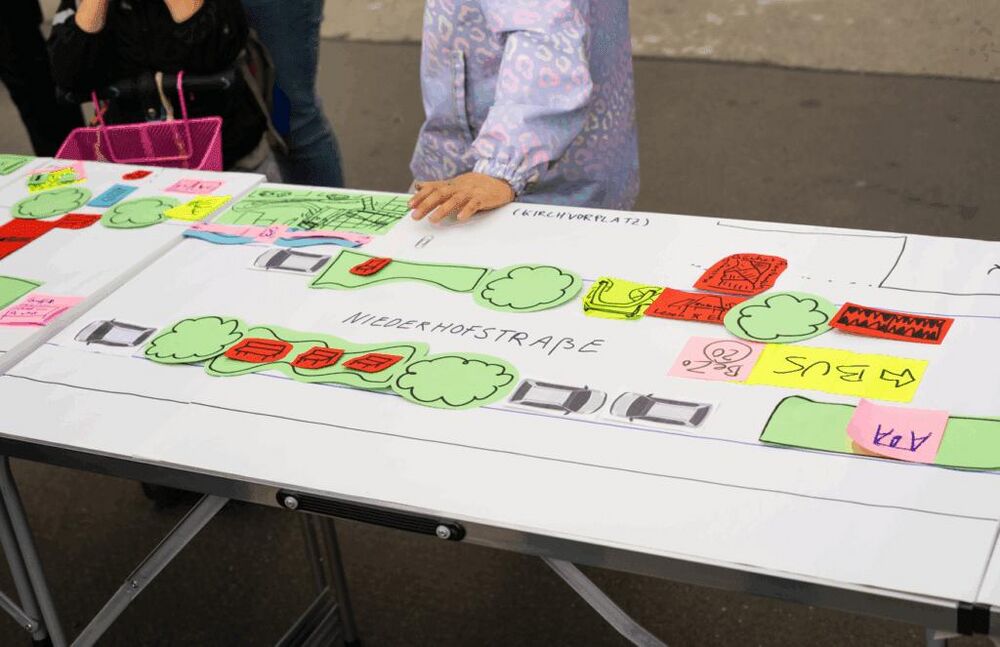
Streetdesign table
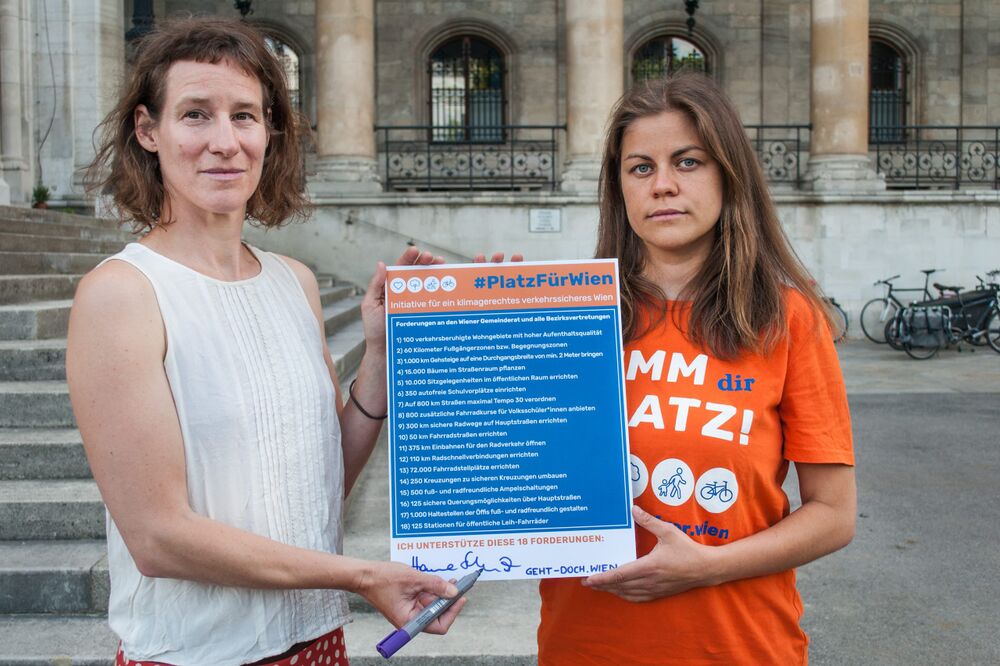
Making specific demands that are backed up by evidence