No edit summary |
No edit summary |
||
| Line 1: | Line 1: | ||
{{#tweekihide:firstHeading|sidebar-right}}{{#arraymap:Evidence,Vision,Action | {{#tweekihide:firstHeading|sidebar-right}} | ||
Welcome to the UNLOCK15-Toolbox - we are collecting tools to empower „agents of change“ from civil society as well as city officials to unlock existing lock-ins. We hope you will find some relevant tools to drive change towards mobility transition in your context! | |||
From experience, three types of tools are need for real change: tools to create and communicate evidence, tools to envision possible futures and scenarios and participatory tools for on-site action. | |||
{{#arraymap:Evidence,Vision,Action | |||
|, | |, | ||
|xxx | |xxx | ||
| Line 5: | Line 10: | ||
|links= | |links= | ||
|title=xxx | |title=xxx | ||
|query=[[semorg-toolbox-tool-type::xxx]] | |query=[[semorg-toolbox-tool-type::xxx]][[semorg-toolbox-visualisation::+]] | ||
|card template=toolbox | |card template=toolbox | ||
|nopagination | |nopagination | ||
|limit=3 | |limit=3 | ||
|order=rand | |order=rand | ||
|intro=<div class="mb-2">{{xxx-intro}}</div> | |||
}}[[xxx|more tools for xxx…]] | }}[[xxx|more tools for xxx…]] | ||
| | | | ||
}} | }} | ||
Latest revision as of 14:04, 19 May 2026
Welcome to the UNLOCK15-Toolbox - we are collecting tools to empower „agents of change“ from civil society as well as city officials to unlock existing lock-ins. We hope you will find some relevant tools to drive change towards mobility transition in your context!
From experience, three types of tools are need for real change: tools to create and communicate evidence, tools to envision possible futures and scenarios and participatory tools for on-site action.
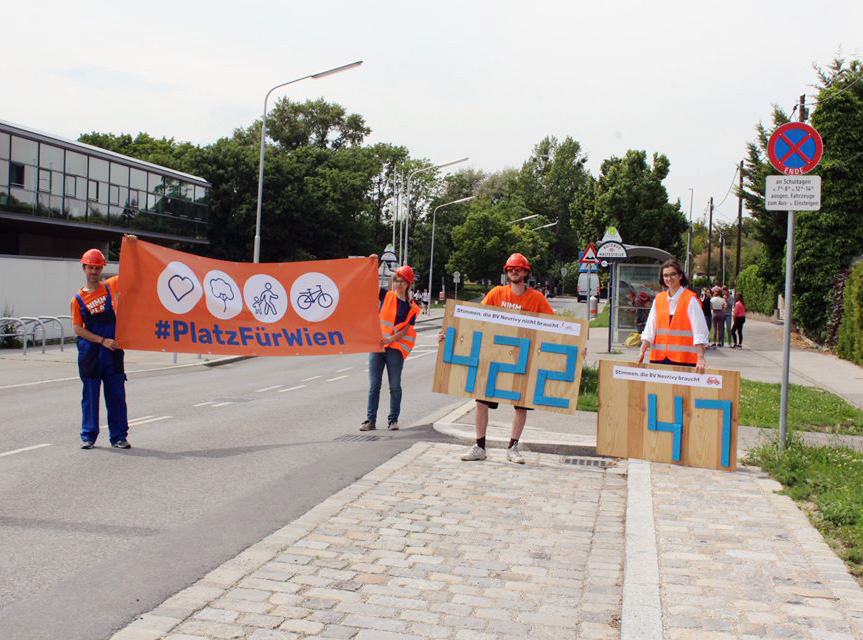
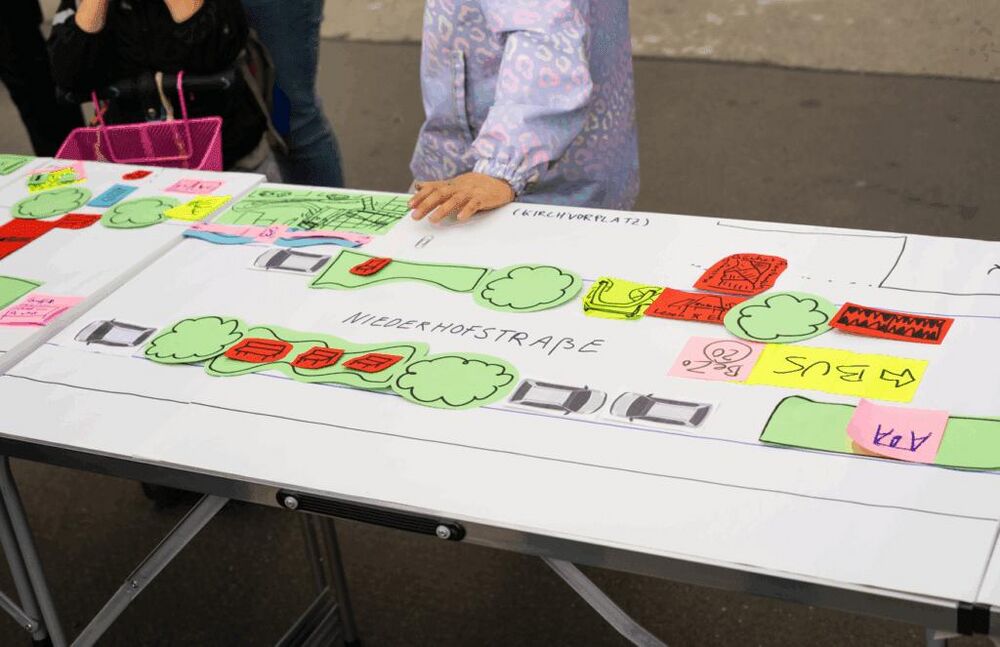
Staging evidence for safer school streets
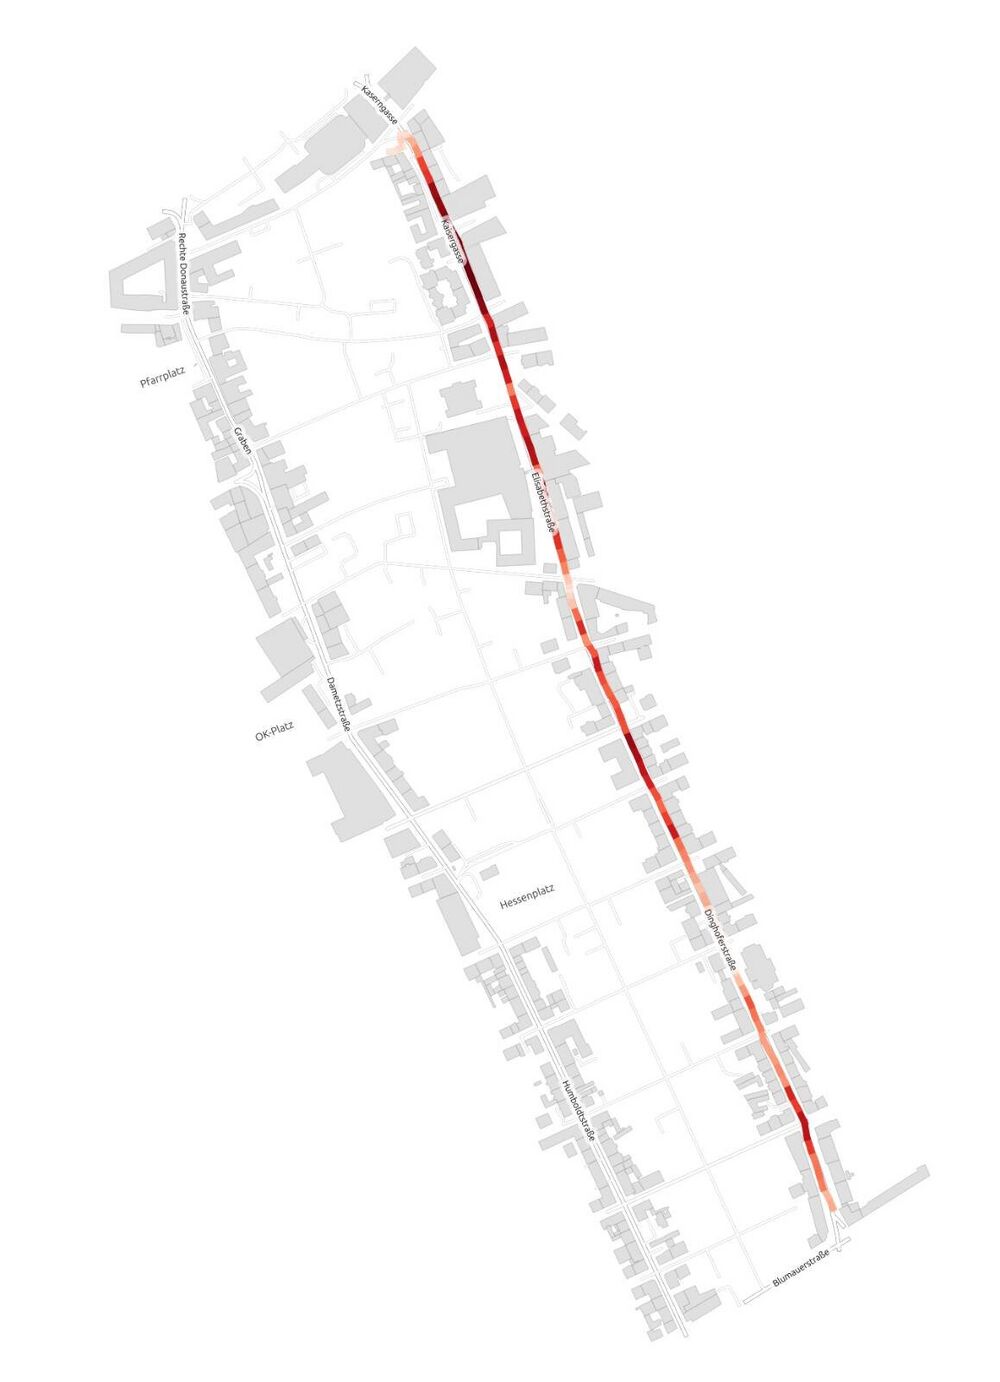
Measuring the speed of public transport
"We can’t reduce the speed limit on this road because the busses would lose time!“ This or similar arguments may come up in discussions about street transformations. In those situations, it can help to bring evidence into the discussion. For example by measuring the speed of busses. Think in advance how to make your data collection as valid as possible within your ressources. To produce solid evidence about the speed of public transport we suggest the following steps:
- Make a plan how you will collect your data: What do you want to measure (one busline in both directions between bus stop X and Y), when (on peak/off peak, which days) and how often (how many times per day)
- Install an App that collects GPX-Tracks (data that links speed with location)
- Ride the busses according to your data collection plan
- Find someone who knows how to use QGIS (open source program for making maps) and install the plug-in for GPX Segment importer (https://plugins.qgis.org/plugins/GpxSegmentImporter/#plugin-about)
- If everything works out the result should be maps like the ones you see here.
- Think about how you want to communicate the data: In a confidential setting or rather to a bigger audience?
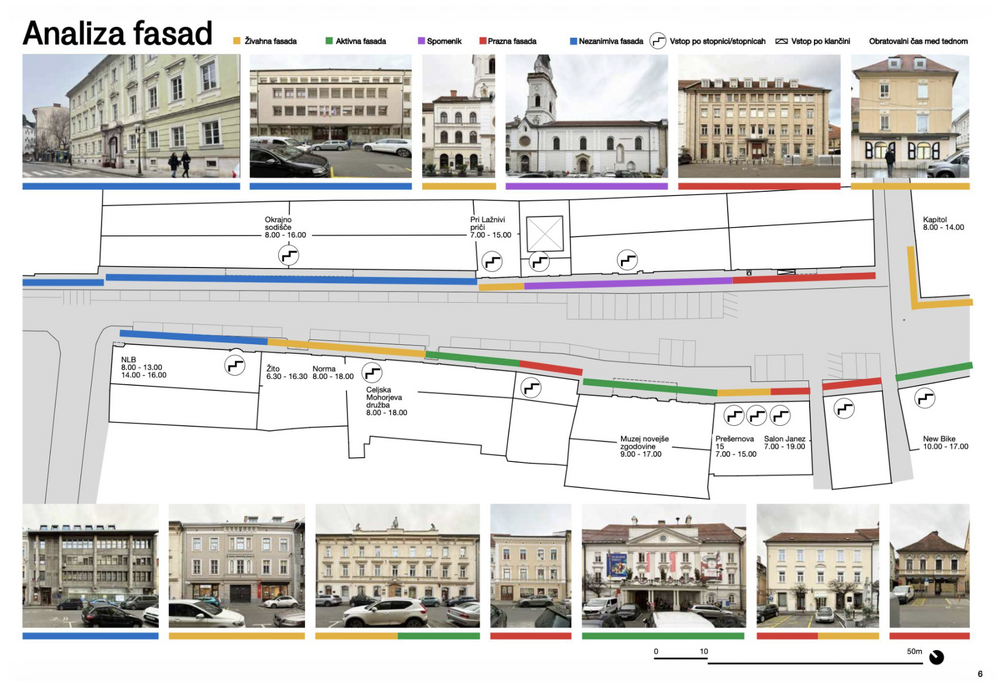
Mapping and analysing facades
"We need parking space otherwise our shops will die!" This is an argument often brought forward by opponents of street transformation. The urban design studio prostorož confronted this claim with evidence. They analysed the facades of the street by the following categories: Lively facade, active facade, monument, empty facade, unremarkable facade. They could show that a lot of the ground floor was at that point in time not occupied.
prostorož combined this analysis with analysing parking place occupancy and human behaviour to build an even stronger argument: A street full of cars is not helping shops at the moment. By combining all these analysis they managed to convince the decision makers to give that street a human friendly makeover!
Newspaper of Tomorrow
Forecasting change
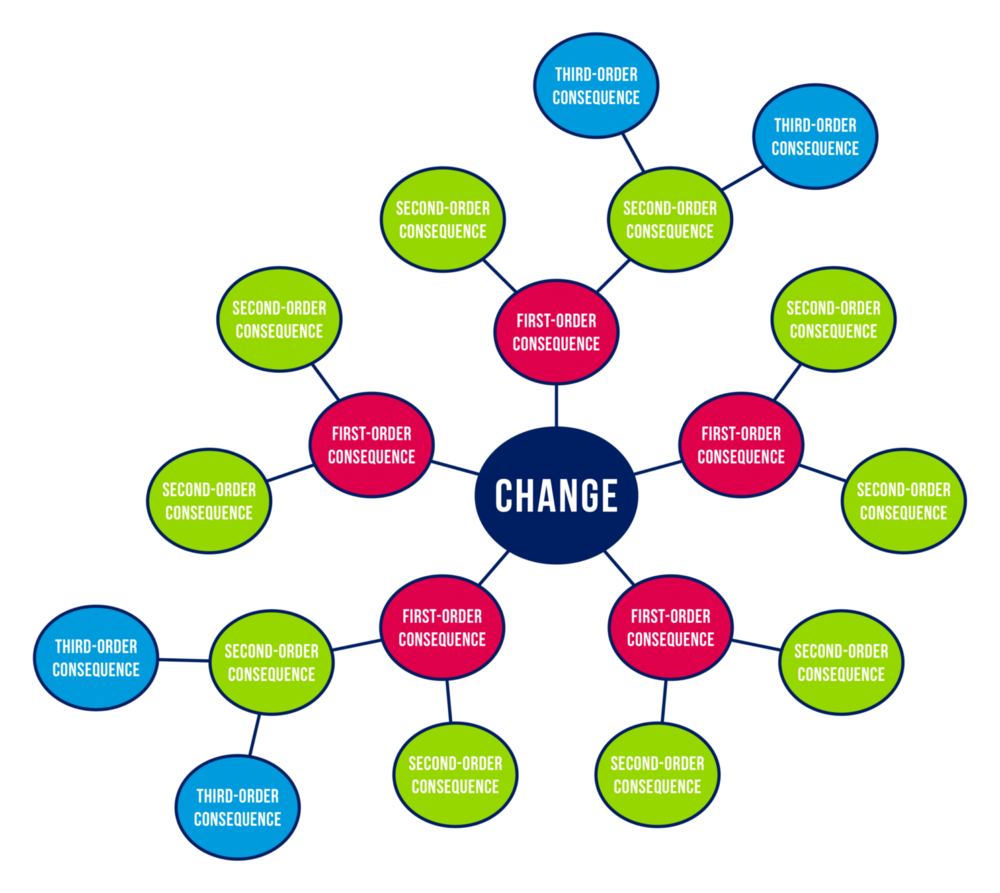
The Futures Wheel is a visual foresight and brainstorming tool invented by American futurist Jerome C. Glenn in 1971, designed to graphically map the primary, secondary, and tertiary consequences of a specific event, trend, or change using a circular diagram with concentric rings radiating from a central hub.
The method works by placing a central change or issue at the core of the diagram — for example, a new policy, a social trend, or a strategic decision — and then working outward in layers. The first ring captures direct, first-order consequences; from each of those, a second ring of second-order consequences is generated, and so on — surfacing implications beyond the immediate and obvious, and helping develop an understanding of causality through ripple effects.
Building durable groups with low hierachies

Bikebus
New local collaborations to boost change!