From Unlock15
Jump to: navigation, search
Evidence
← All tools with a focus on: Evidence / Vision / Action
15min-City online Maps
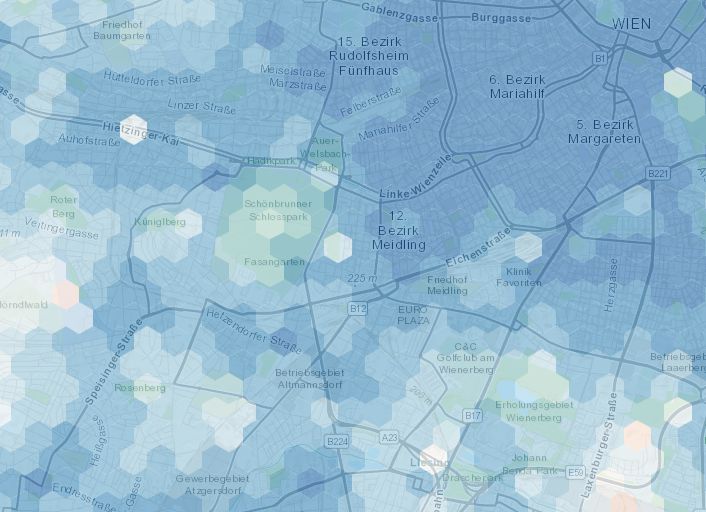
The map shows how close services are if one lives in different areas of the city: in red areas the time needed to access the closest services is on average higher than 15 minutes, while the blue are 15-minute areas. We consider the average time of accessibility to the closest 20 POIs.
Author/Licence: prostorož
Collaborative heat maps
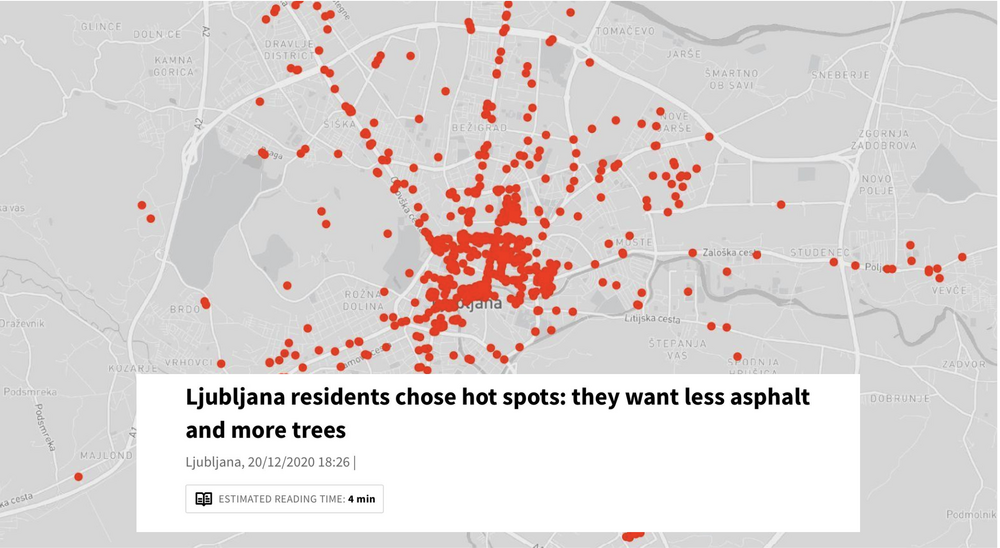
Websites like mapperoni and uMap let you create maps with layers in a minute, embed them in your site or share them with others to contribute. An example: The urban design office prostorož invited citizens of Ljubljana in 2020 to vote for locations they experience as hot. In three weeks, they cast around 700 votes. The data was consistent with the locations of heat islands measured by satellite thermal imaging. The responses showed that people change routes and habits in the summer or avoid certain locations in the city altogether due to the heat. Respondents also suggested their own cooling measures - they want more and bigger trees, less asphalt, less concrete, and less parking spaces. This map was then published in newspapers and reached a big audience.
Author/Licence: prostorož
Collecting data about parking occupancy
Opponents of street transformation often claim, that there are to little parking possibilities. But is that true? Evidence in Ljubljana showed that the city has rather a problem with how parking space is unevenly occupied.
Author/Licence: prostorož
Low effort survey in public space

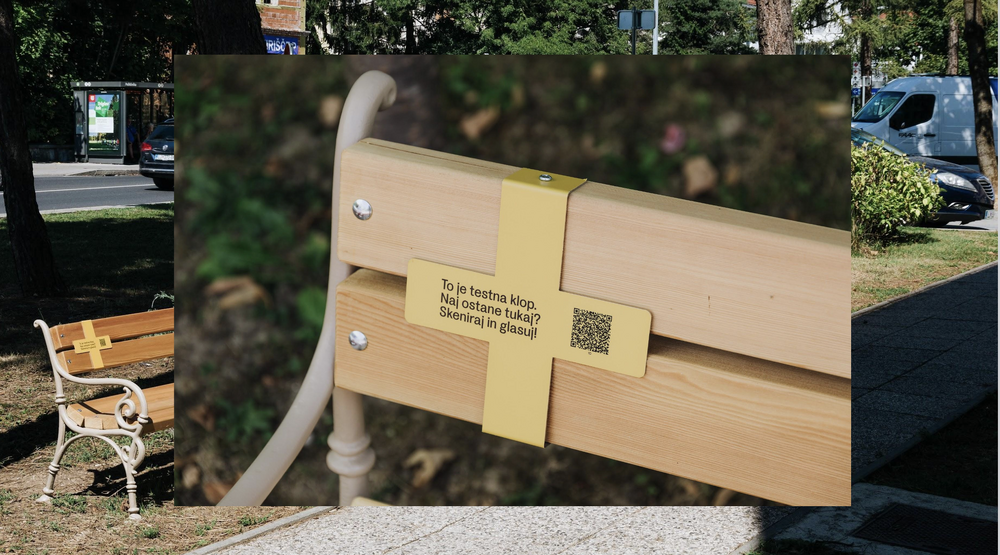
The picture stems from Ljubljana, where the urban design studio prostorož set up benches in public space. They attached a QR-Code, where people could vote if they wanted this bench to stay. In a short period of time about 400 people voted, that they would like the bench to stay because they frequently use it. On this basis prostorož talked to the people in charge of that area. The survey was enough evidence for them to let the benches stay! What a success!

In case this inspires you to take action: Make sure that the QR-code is made out of solid material, that endures the time you want the survey to last. The tool material link will lead you to a website where different survey tools are offered, a lot of them without additional costs.
Author/Licence: prostorož
Mapping and analysing facades

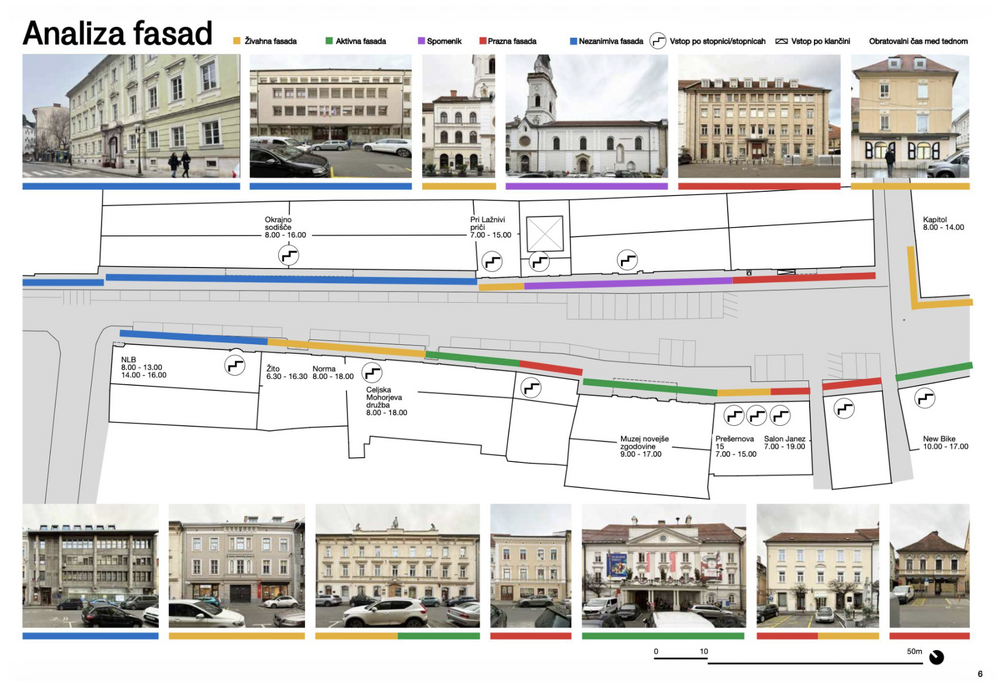
"We need parking space otherwise our shops will die!" This is an argument often brought forward by opponents of street transformation. The urban design studio prostorož confronted this claim with evidence. They analysed the facades of the street by the following categories: Lively facade, active facade, monument, empty facade, unremarkable facade. They could show that a lot of the ground floor was at that point in time not occupied.

prostorož combined this analysis with analysing parking place occupancy and human behaviour to build an even stronger argument: A street full of cars is not helping shops at the moment. By combining all these analysis they managed to convince the decision makers to give that street a human friendly makeover!
Author/Licence: prostorož
Observing and visualising human behaviour in public space

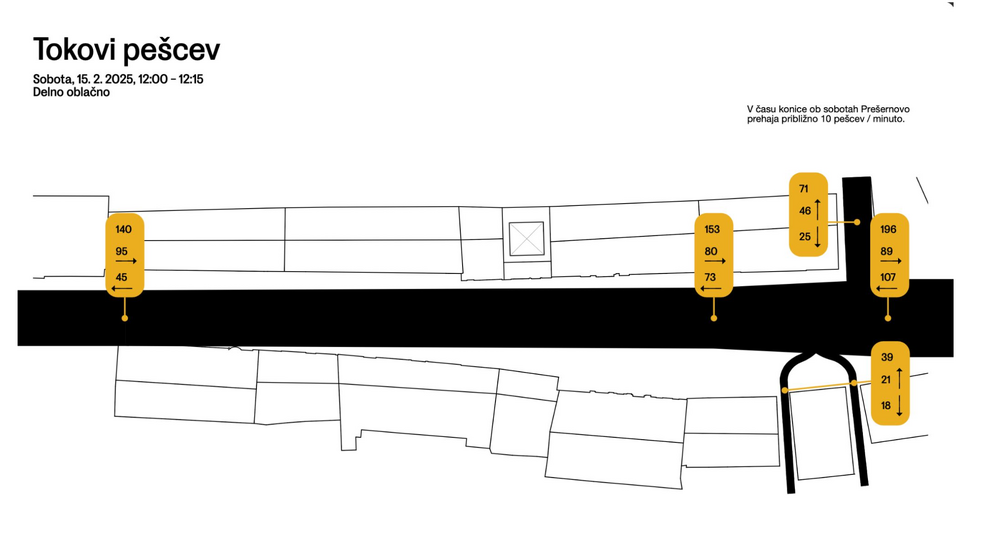
Collecting data on how people use space can give you a solid foundation to discuss how it should be designed. The free public live app helps you to collect the data you need when observing people. The second link leads you to a website where you can download an analog version with excel sheets. The picture is an example how you could visualise the collected data, done by urban design studio prostorož.
Author/Licence: Leyla M
Petition: Collect signatures to back up your local vision!
You have a very clear picture of the local change you want to achieve? You want to show decision makers how much support your vision locally has? Then a petition might be your cup of tea to drive change.