Welcome to the UNLOCK15-Toolbox - we are collecting tools to empower „agents of change“ from civil society as well as city officials to unlock existing lock-ins. We hope you will find some relevant tools to drive change towards mobility transition in your context!
From experience, three types of tools are need for real change: tools to create and communicate evidence, tools to envision possible futures and scenarios and participatory tools for on-site action.
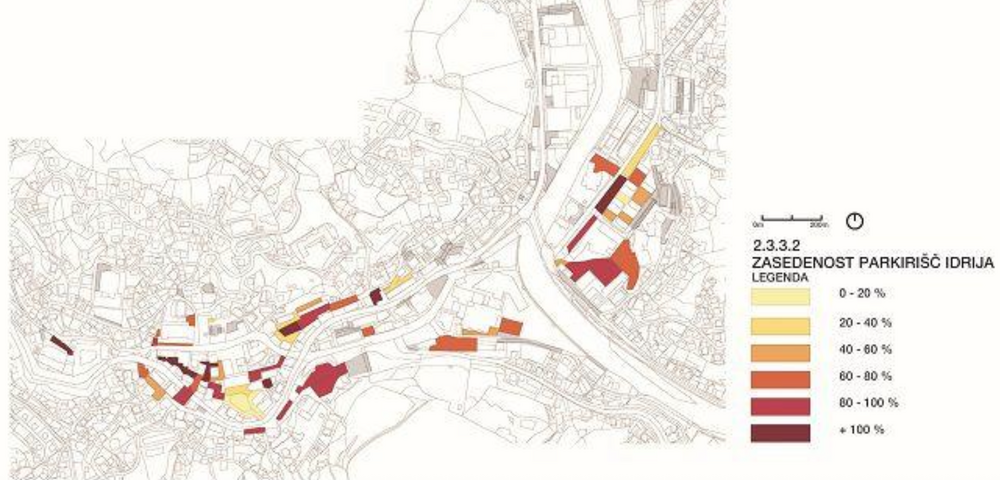
Collecting data about parking occupancy
Opponents of street transformation often claim, that there are to little parking possibilities. But is that true? Evidence in Ljubljana showed that the city has rather a problem with how parking space is unevenly occupied. The urban design studio prostorož suggested the following steps to collect data about parking space occupancy.
- define the area of observation (street / block / neighbourhood)
- prepare the site plan of all the parking spots you will observe / have access to, regardless of ownership
- set a hypothesis (e.g. parking is occupied by employees, not generating income for local shops)
- create an observation plan: check occupancy one Wednesday and Saturday; and granular occupancy of observed parking lots every 2 hours, starting from 5 AM to 12:00 PM
- graphically present data for example via Q-GIS and interpret results
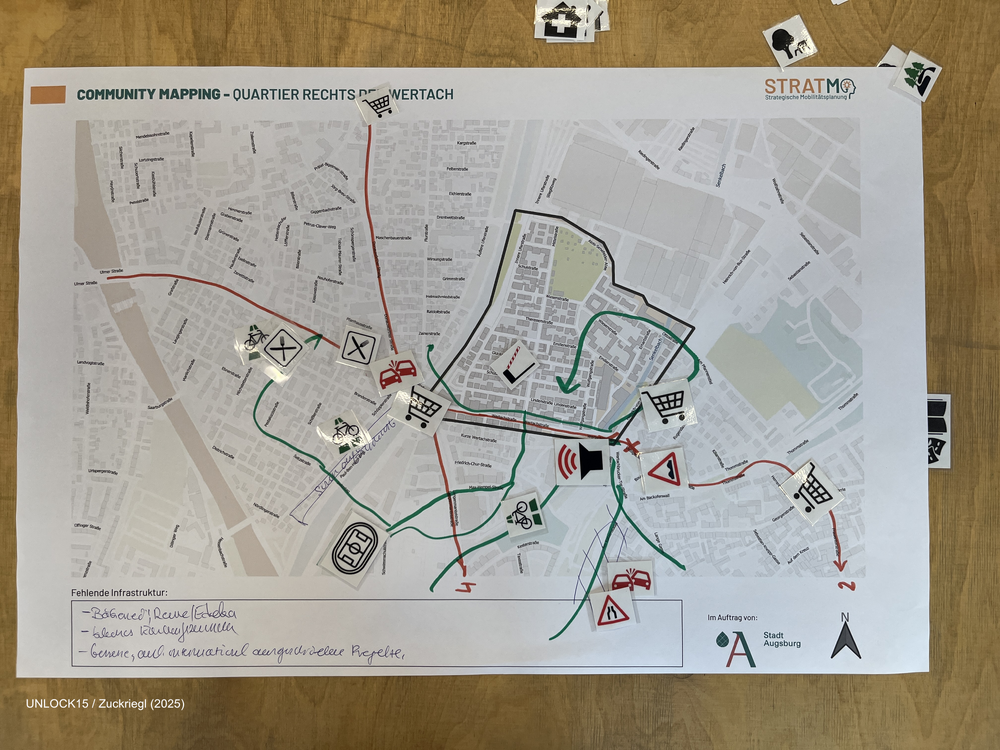
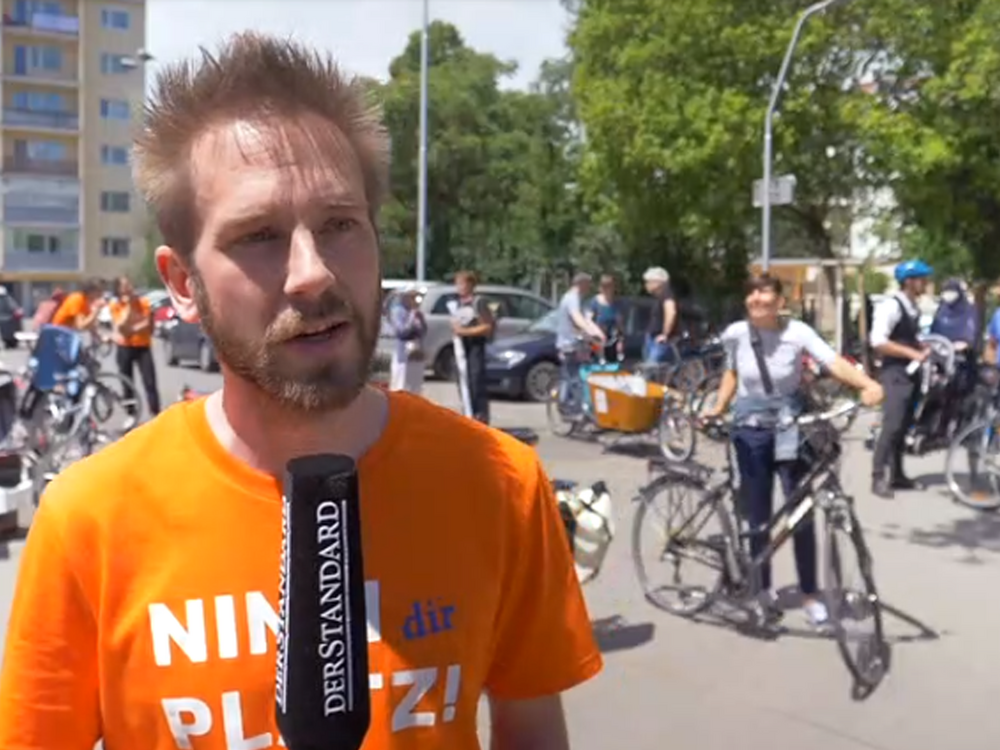
Community mapping
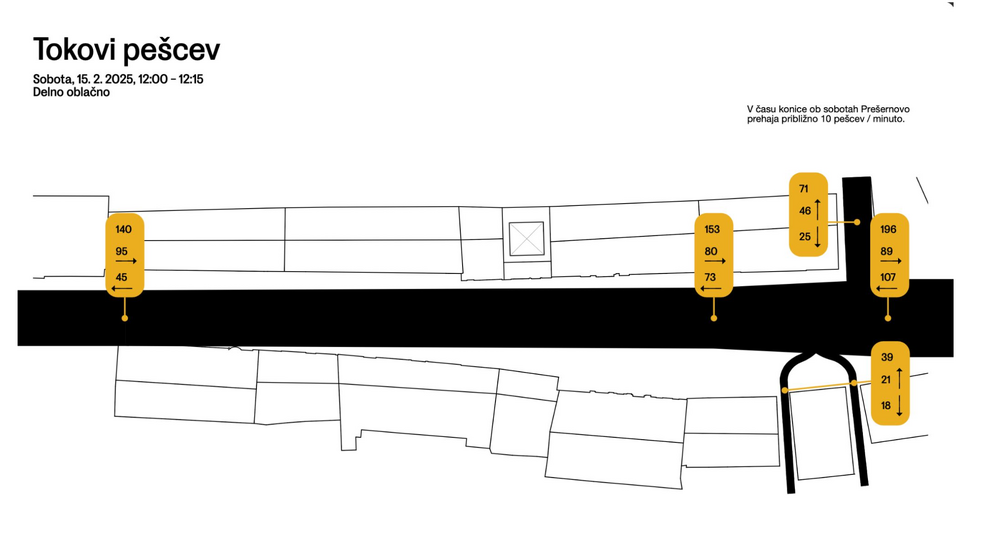
Observing and visualising human behaviour in public space
Tools to help communicate within a group

Learning public participation hub

Onboarding framework
The Onboarding Framework is a structured yet flexible tool designed to help grassroots civil society initiatives welcome and integrate new volunteers with as little friction as possible.
The framework helps initiatives answer three core questions: What does a new volunteer need to know, feel, and do to get started? Where do their skills and interests fit best? And how can the organization make that first step feel easy, welcoming, and worthwhile?
By providing a clear path from curiosity to commitment, the Onboarding Framework reduces dropout at the earliest stage, builds a sense of belonging from day one, and ensures that volunteer energy is channeled effectively — strengthening the initiative's capacity from the bottom up.
Window Banner
Platform for free meeting spaces