From Unlock15
No edit summary |
No edit summary |
||
| Line 1: | Line 1: | ||
{{#semorg- | {{#semorg-overview:toolbox | ||
| | |list intro=All tools with a focus on: [[Evidence]] / [[Vision]] / [[Action]] | ||
|filter links=toolbox-tool-type,toolbox-language,toolbox-spatial-context,toolbox-effort-level,toolbox-lock-in-cluster | |filter links=toolbox-tool-type,toolbox-language,toolbox-spatial-context,toolbox-effort-level,toolbox-lock-in-cluster | ||
|card template=toolbox | |card template=toolbox | ||
|nopagination | |nopagination | ||
}} | }} | ||
Revision as of 12:45, 15 May 2026
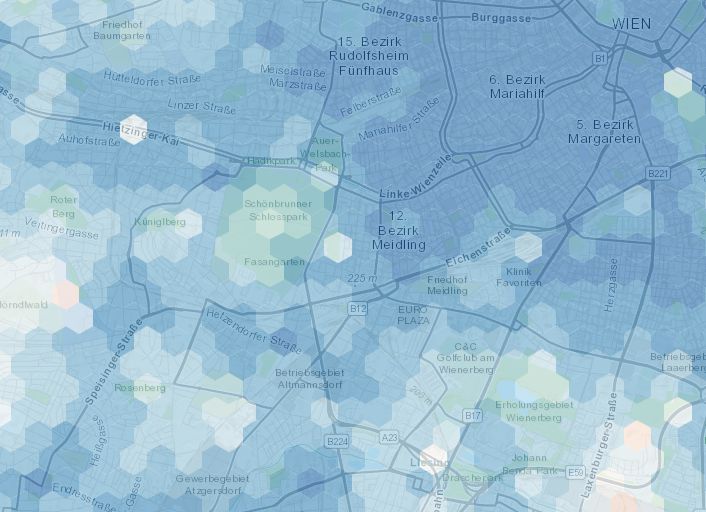
15min-City online Maps
The map shows how close services are if one lives in different areas of the city: in red areas the time needed to access the closest services is on average higher than 15 minutes, while the blue are 15-minute areas. We consider the average time of accessibility to the closest 20 POIs.

Align on Your Impact Goals
Get crystal clear on the change you want to achieve, in the near-term and long-term. Impact is a very loosely used term universally, and can be used to describe an influence or effect on virtually anything. Taking time to explore and align on your impact goals will ensure that your team and stakeholders are all working towards the same vision of success.
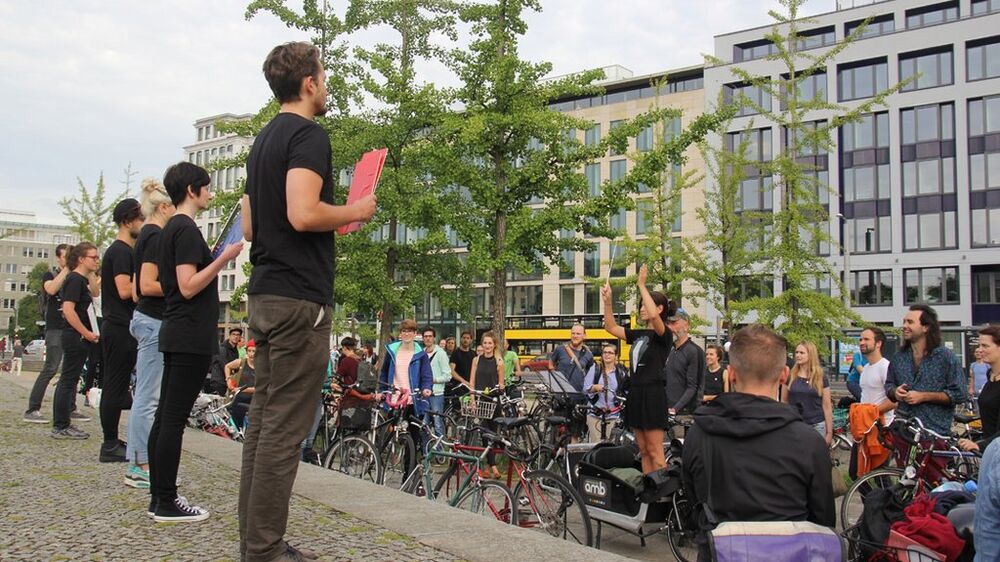
Art Spin bike tour
The aim of the tour is to challenge traditional contexts of exhibiting art by producing new creative content in unconventional locations, while at the same time promoting urban cycling and sustainable communities. See also RAD performance in Vienna as an example.

Bikebus
Bikebus is an organized bicycle group for children who cycle safely to school together with accompanying adults. Like a school bus, only by bicycle.

Building durable groups with low hierachies
Defining goals, structures, roles and means of decision making are all crucial parts of founding and maintaining collectives, cooperatives, and other groups. Many aspects of organisation however remain ad hoc, informal and opaque, creating the possibility of power imbalances, misunderstandings and exclusion. The link will lead you to website with key questions that any group should consider and define during its formation.
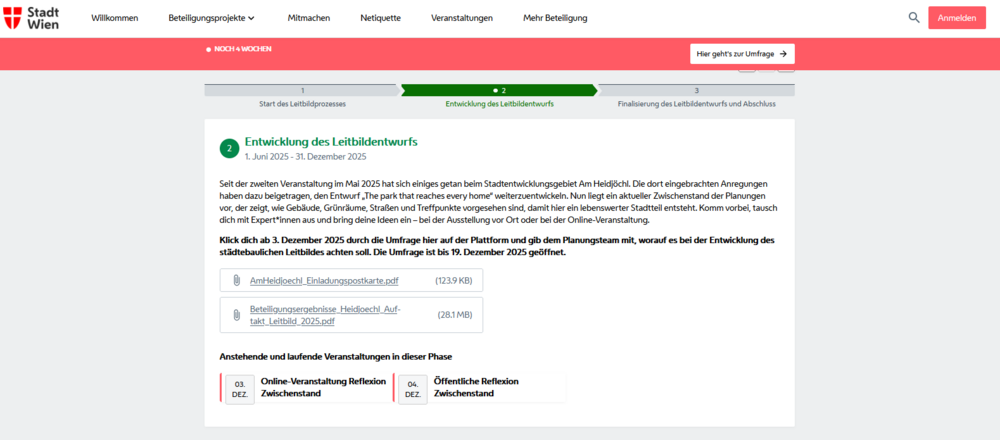
Centralized participation plattform
"Mitgestalten.wien" is an example for a centralized participation plattform. We used it to run a survey for Unlock15 in Vienna about the future development of a street. "decidim.org" and "govocal.com" are plattforms that can help you set up a centralised participation plattform.
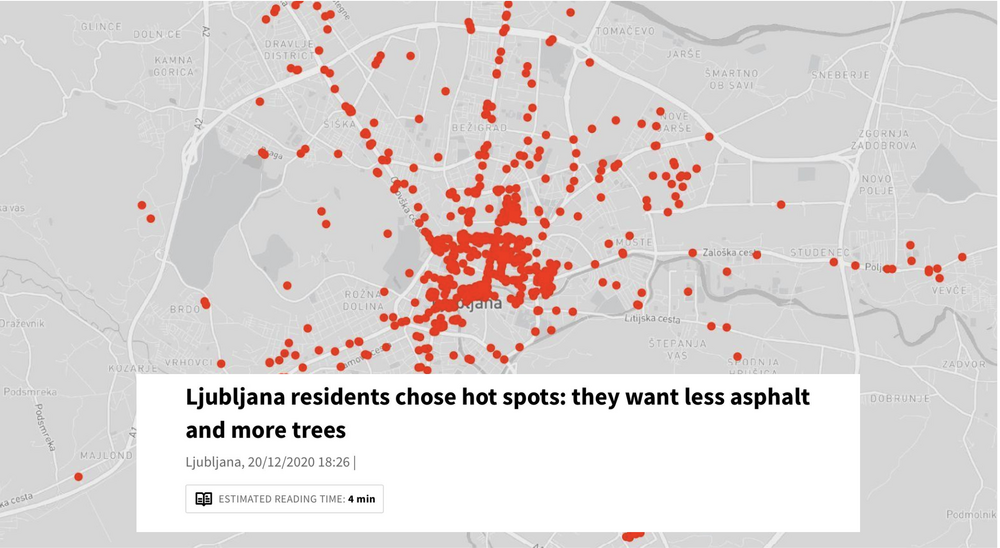
Collaborative heat maps
Websites like mapperoni and uMap let you create maps with layers in a minute, embed them in your site or share them with others to contribute. An example: The urban design office prostorož invited citizens of Ljubljana in 2020 to vote for locations they experience as hot. In three weeks, they cast around 700 votes. The data was consistent with the locations of heat islands measured by satellite thermal imaging. The responses showed that people change routes and habits in the summer or avoid certain locations in the city altogether due to the heat. Respondents also suggested their own cooling measures - they want more and bigger trees, less asphalt, less concrete, and less parking spaces. This map was then published in newspapers and reached a big audience.
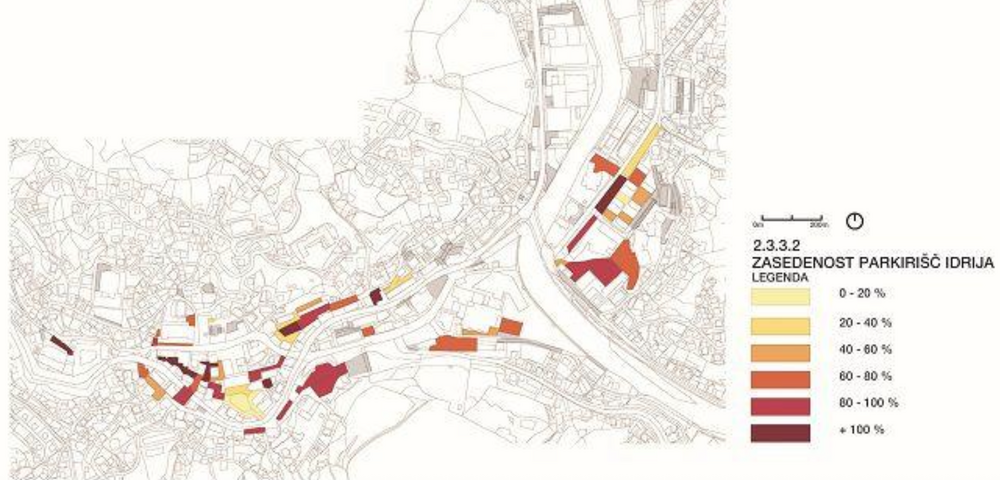
Collecting data about parking occupancy
Opponents of street transformation often claim, that there are to little parking possibilities. But is that true? Evidence in Ljubljana showed that the city has rather a problem with how parking space is unevenly occupied. The urban design studio prostorož suggested the following steps to collect data about parking space occupancy.
- define the area of observation (street / block / neighbourhood)
- prepare the site plan of all the parking spots you will observe / have access to, regardless of ownership
- set a hypothesis (e.g. parking is occupied by employees, not generating income for local shops)
- create an observation plan: check occupancy one Wednesday and Saturday; and granular occupancy of observed parking lots every 2 hours, starting from 5 AM to 12:00 PM
- graphically present data for example via Q-GIS and interpret results
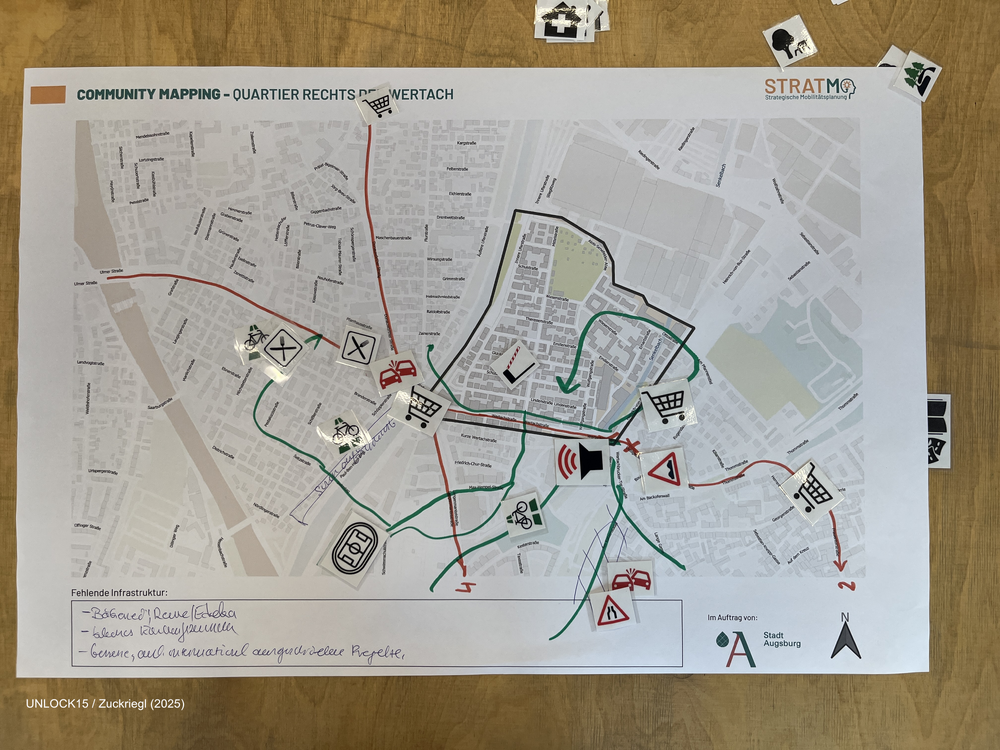
Community mapping
Collaboratively mapping maps about a neighbourhood can shed light on factors that influence everyday transport-related decisions.

Creating a team culture
Capture the shared purpose, values and behaviours of a team with this template from mobilisation Lab. This helps to build an environment in which everybody feels safe and motivated.

Crosswalk action
During their campaign for a safer city, the initiative "Platz für Wien" temporarily rolled out crosswalks. Places were chosen where crosswalks would make a big difference for the safness of pedestrians.

Crowd Funding
Crowdfunding — and specifically civic crowdfunding — is an approach where communities, individuals, and organizations collectively finance local public projects through online platforms, often in combination with contributions from municipalities, foundations, or companies.
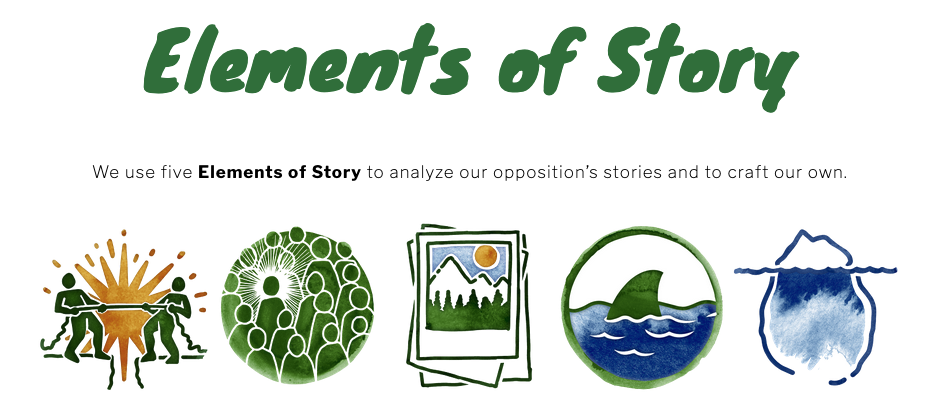
Developing a convincing story for your campaign
The framework of "Story-Based Strategy" helps you figure out your campaign’s narrative strategy. It’s composed of tools or worksheets that you can use to analyze the opposition’s story, the current popular narrative about your issue, and develop a way of pitching or talking about your issue that will win over the folks you need to win!

Efficient decision making in low hierarchy settings
Sociocracy is a governance and decision-making method designed to enable self-organization in groups and organizations without traditional top-down authority. Rather than relying on majority votes or hierarchical decisions, sociocracy is based on the consent principle: a decision is valid as soon as no member of the circle has a serious, well-founded objection — meaning arguments count, not the number of votes.
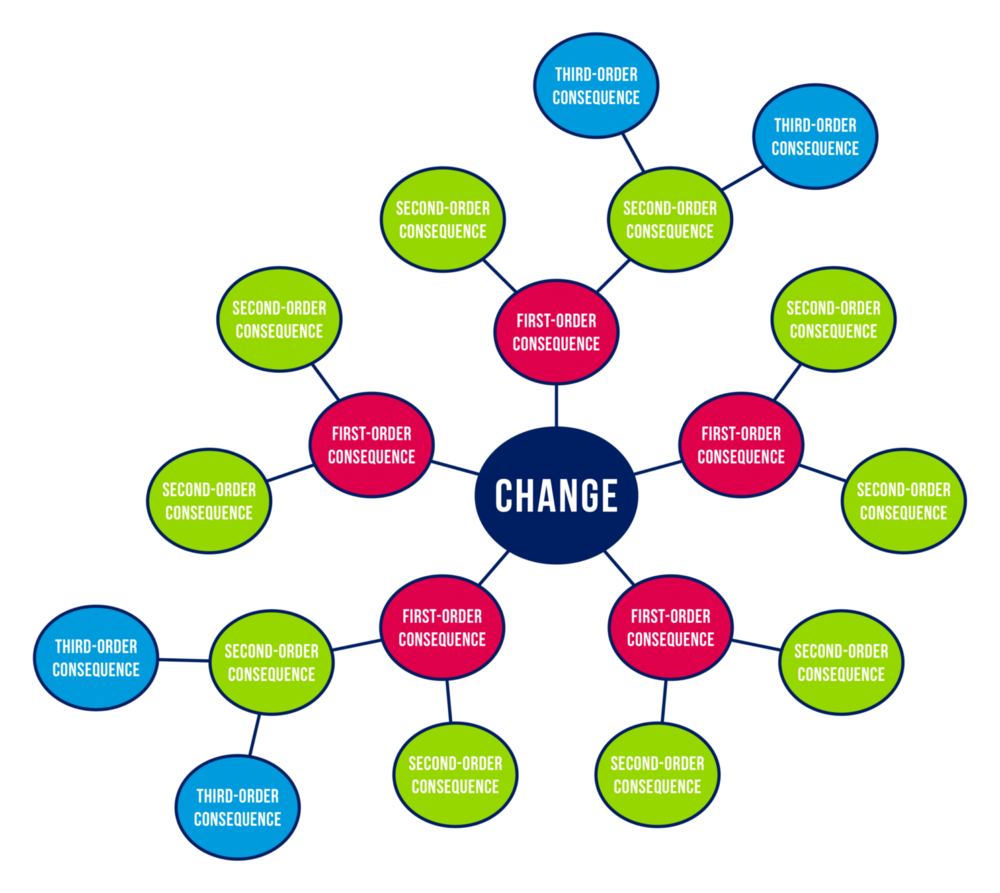
Forecasting change
The Futures Wheel is a visual foresight and brainstorming tool invented by American futurist Jerome C. Glenn in 1971, designed to graphically map the primary, secondary, and tertiary consequences of a specific event, trend, or change using a circular diagram with concentric rings radiating from a central hub.
The method works by placing a central change or issue at the core of the diagram — for example, a new policy, a social trend, or a strategic decision — and then working outward in layers. The first ring captures direct, first-order consequences; from each of those, a second ring of second-order consequences is generated, and so on — surfacing implications beyond the immediate and obvious, and helping develop an understanding of causality through ripple effects.
Gamification of climate friendly behaviour
Gamification is the application of game-design mechanics — such as points, rewards, competitions, challenges, and progress tracking — to non-game contexts in order to motivate behaviour change. In the context of urban sustainability and mobility, it turns everyday choices like taking public transport, cycling, or saving energy into visible, rewarding actions that feel meaningful and fun rather than obligatory.

Getting to the core of human behaviour
The Five Whys is a simple yet powerful research method from human-centered design. Starting with a broad question about a person's habits or behaviours, you ask "why" five times in a row — not horizontally ("why else?") but vertically, going deeper with each answer until you uncover the emotional and human roots of a problem. The method takes only about 15 minutes, requires nothing more than pens and paper, and is designed to get to the core of a person's beliefs and motivations.

Headlines from the future
A participatory activity to support aspirational goal setting, by imagining a more positive future.