
Align on Your Impact Goals

Building durable groups with low hierachies
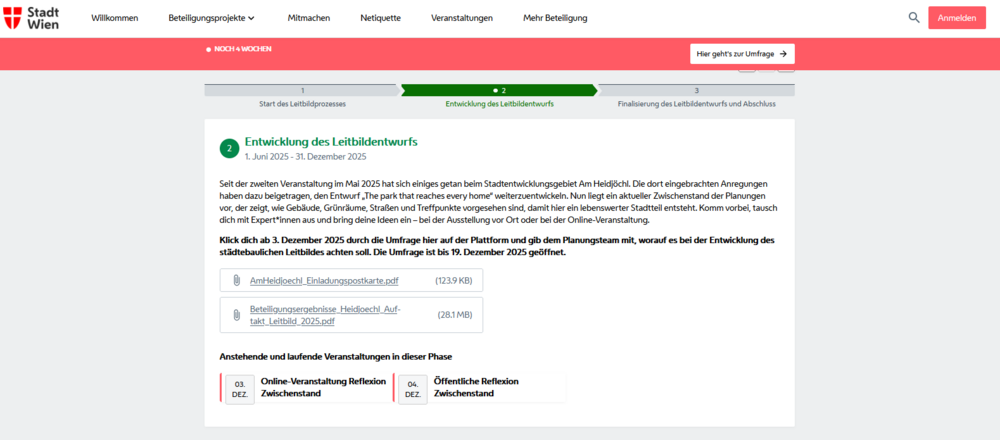
Centralized participation plattform
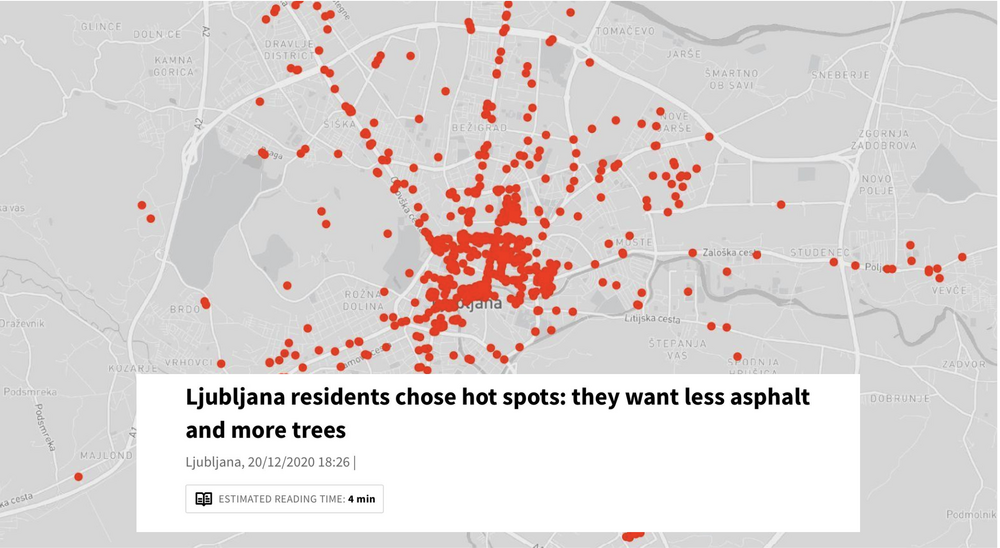
Collaborative heat maps

Creating a team culture
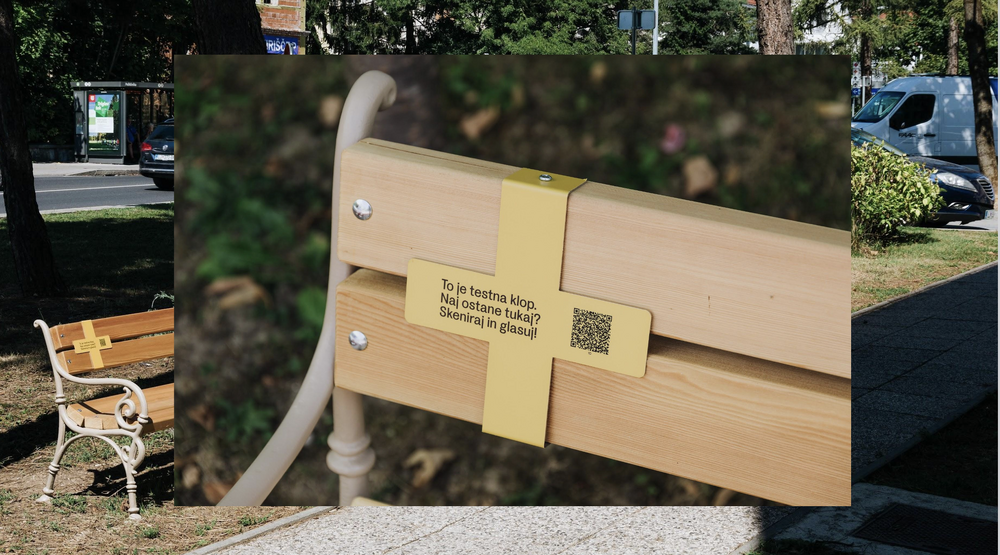
Low effort survey in public space
The picture stems from Ljubljana, where the urban design studio prostorož set up benches in public space. They attached a QR-Code, where people could vote if they wanted this bench to stay. In a short period of time about 400 people voted, that they would like the bench to stay because they frequently use it. On this basis prostorož talked to the people in charge of that area. The survey was enough evidence for them to let the benches stay! What a success!
In case this inspires you to take action: Make sure that the QR-code is made out of solid material, that endures the time you want the survey to last. The tool material link will lead you to a website where different survey tools are offered, a lot of them without additional costs.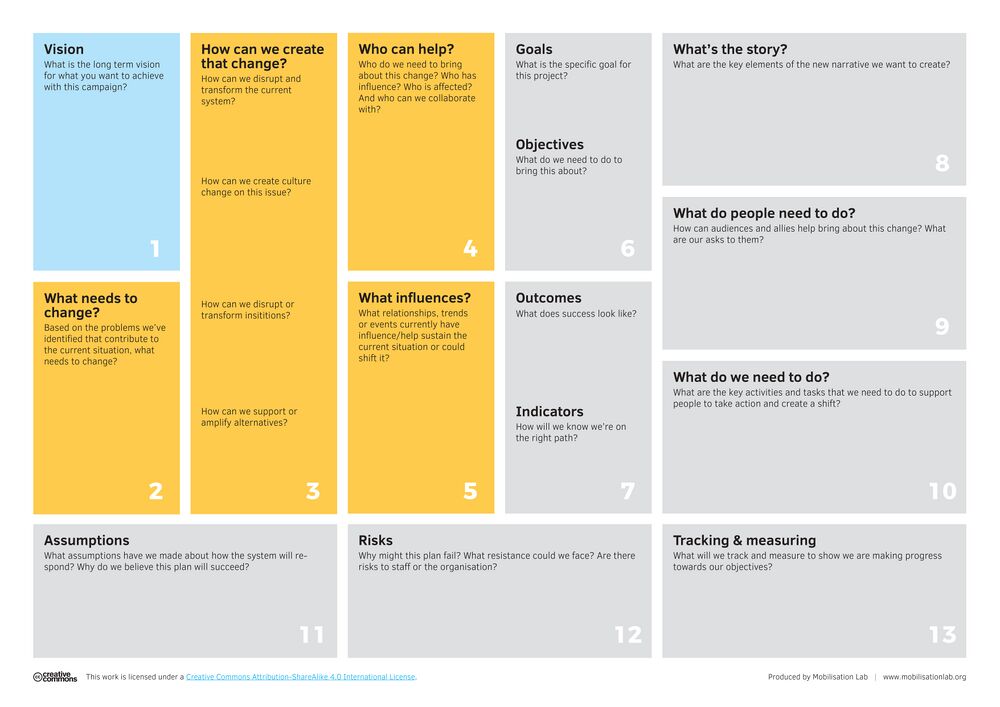
Make your vision achievable with a Campaign plan
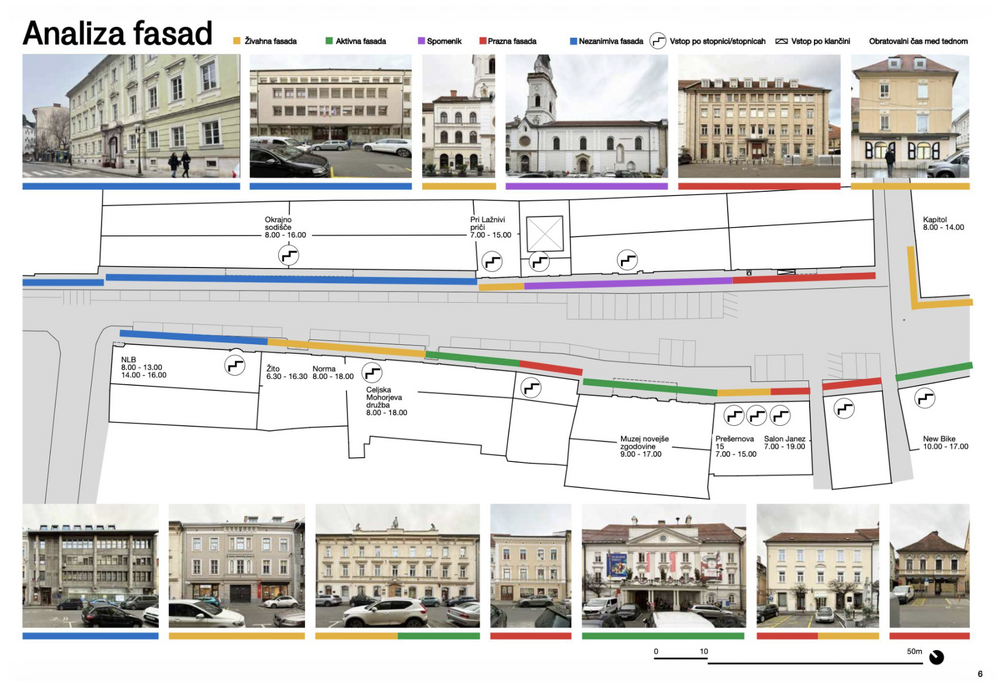
Mapping and analysing facades
"We need parking space otherwise our shops will die!" This is an argument often brought forward by opponents of street transformation. The urban design studio prostorož confronted this claim with evidence. They analysed the facades of the street by the following categories: Lively facade, active facade, monument, empty facade, unremarkable facade. They could show that a lot of the ground floor was at that point in time not occupied.
prostorož combined this analysis with analysing parking place occupancy and human behaviour to build an even stronger argument: A street full of cars is not helping shops at the moment. By combining all these analysis they managed to convince the decision makers to give that street a human friendly makeover!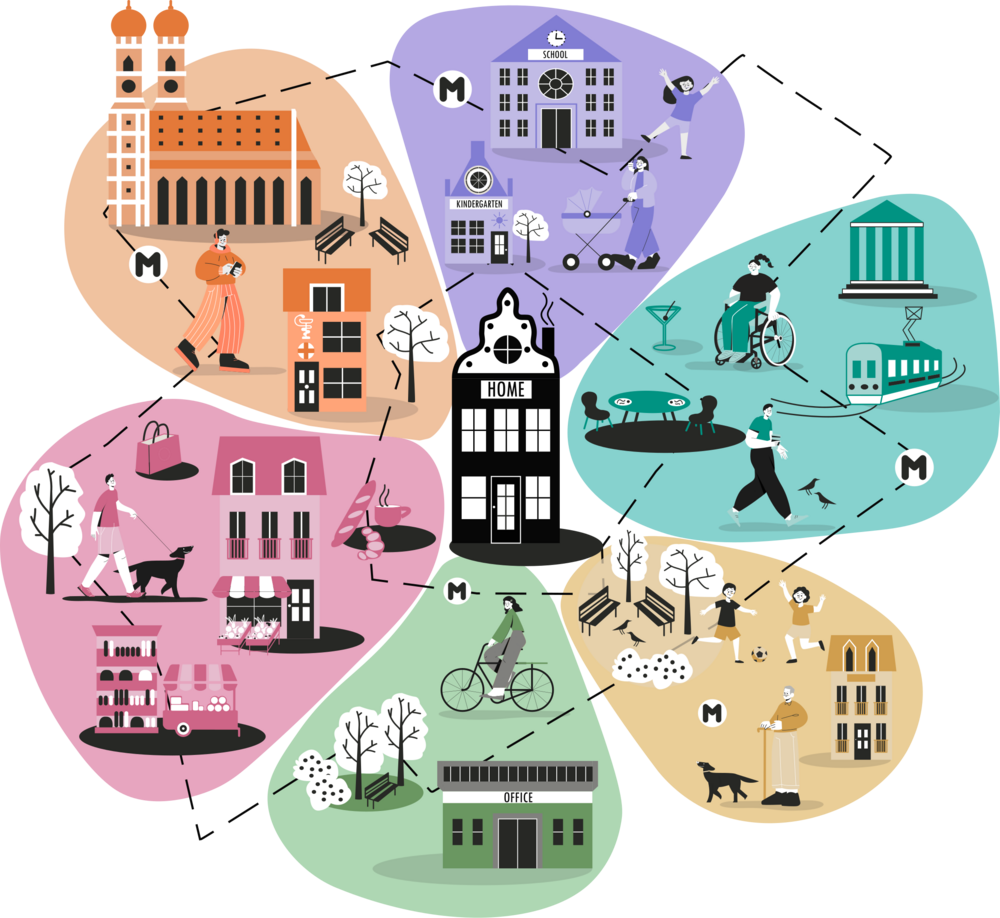
Measuring the 15-min city: Flowers of Proximity
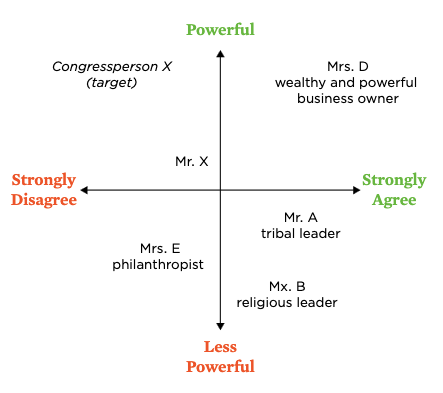
Power Mapping
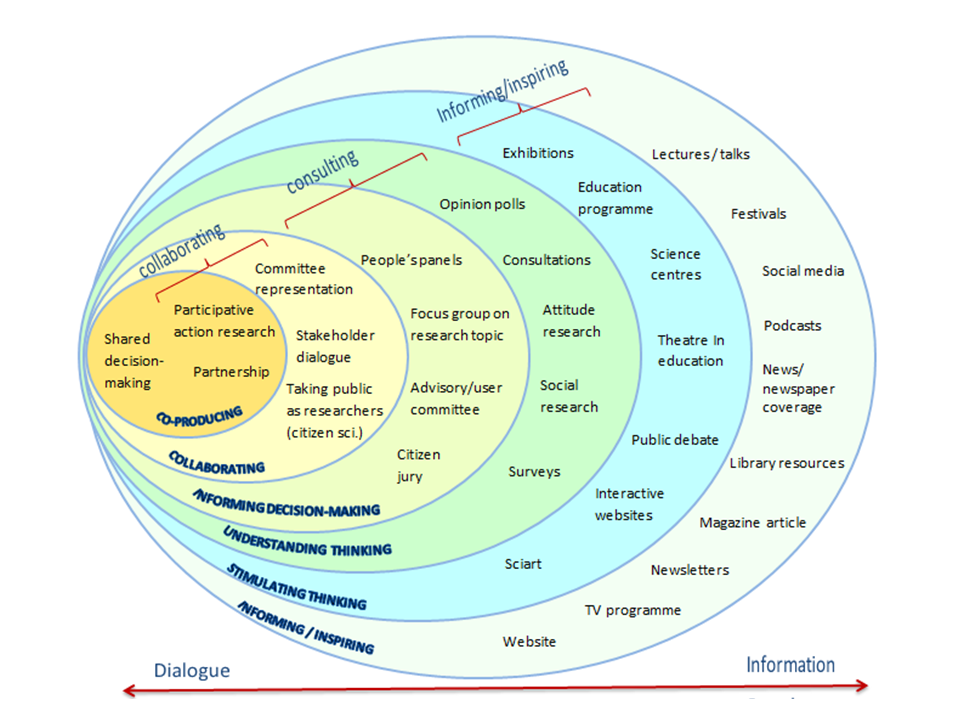
Public Engagement Onion
The Public Engagement Onion is a visual framework originally developed by the Wellcome Trust that maps the different levels and forms of public engagement — from broad, one-directional communication to deep, two-way collaboration.
Like the layers of an onion, the model moves from the outside in: the outer layers represent activities such as broadcasting information or raising awareness, where the engagement is relatively wide-reaching but shallow. Moving toward the center, activities become more interactive and participatory, culminating in shared decision-making and co-creation at the core.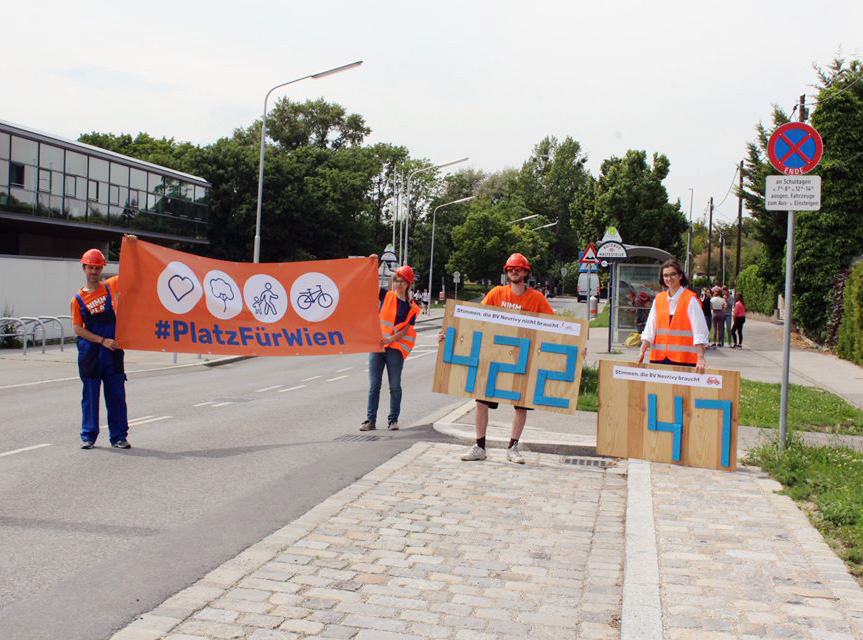
Staging evidence for safer school streets
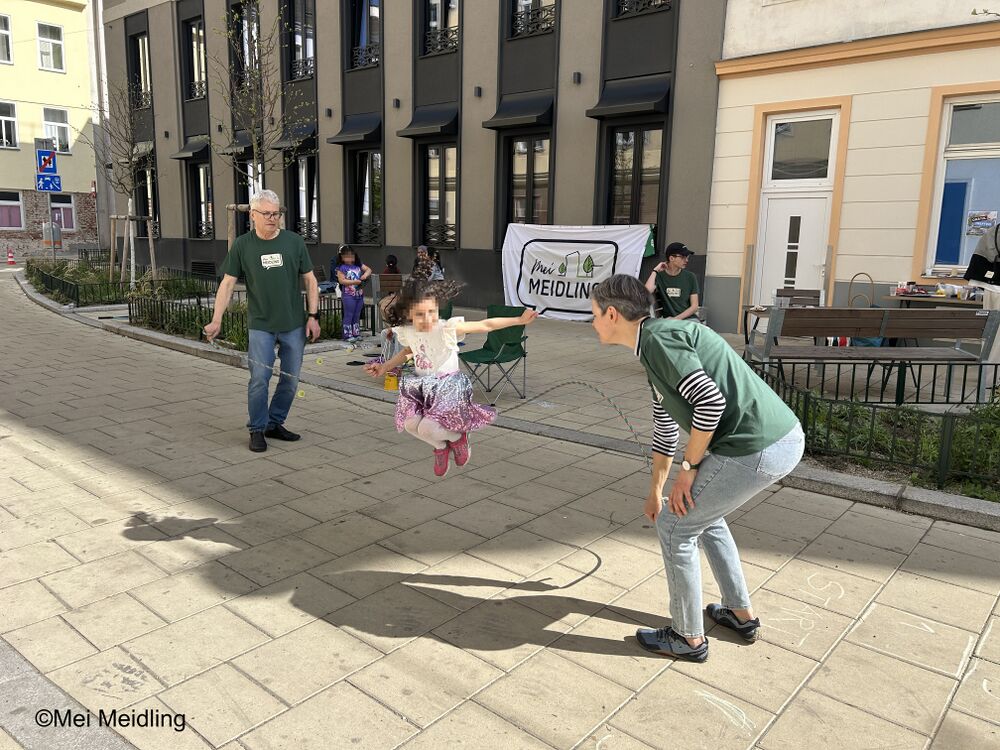
Streetgames