Welcome to the UNLOCK15-Toolbox - we are collecting tools to empower „agents of change“ from civil society as well as city officials to unlock existing lock-ins. We hope you will find some relevant tools to drive change towards mobility transition in your context!
From experience, three types of tools are need for real change: tools to create and communicate evidence, tools to envision possible futures and scenarios and participatory tools for on-site action.
This type of tools help you to collect evidence, which supports the change you are aiming for. Some tools also allow crowd-based approaches to involve citizens in a broad manner. Evidence helps to convince decision makers to back-up change.
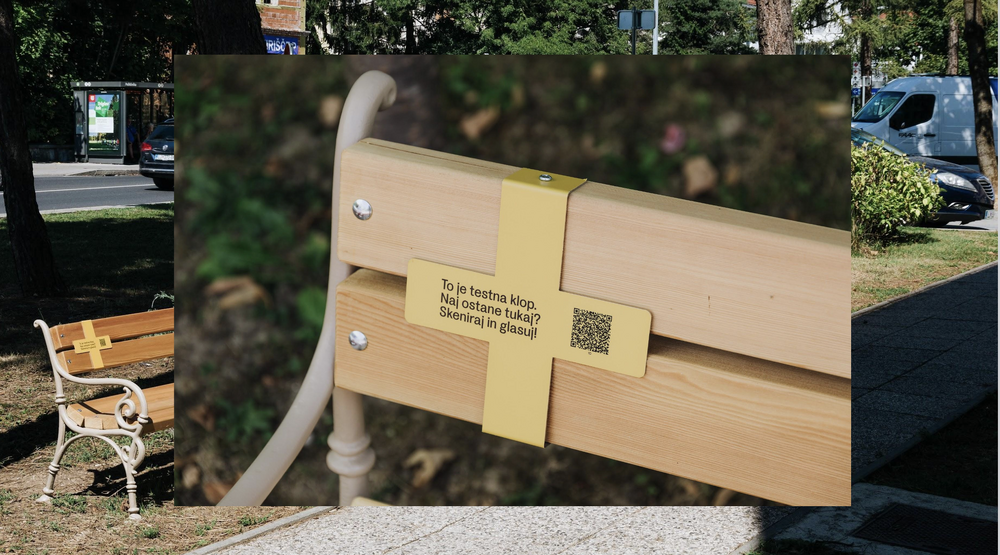
The picture stems from Ljubljana, where the urban design studio prostorož set up benches in public space. They attached a QR-Code, where people could vote if they wanted this bench to stay. In a short period of time about 400 people voted, that they would like the bench to stay because they frequently use it. On this basis prostorož talked to the people in charge of that area. The survey was enough evidence for them to let the benches stay! What a success!
In case this inspires you to take action: Make sure that the QR-code is made out of solid material, that endures the time you want the survey to last. The tool material link will lead you to a website where different survey tools are offered, a lot of them without additional costs.
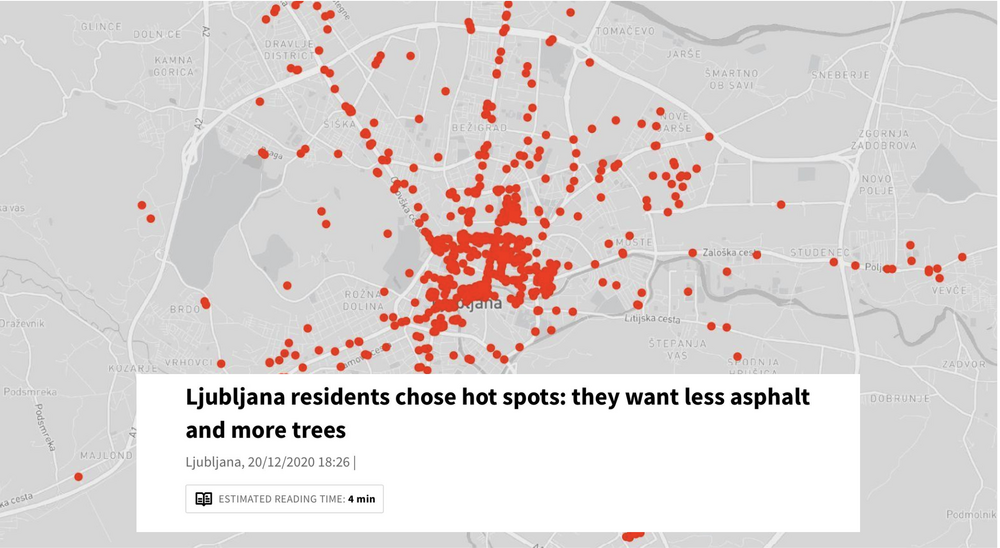
Websites like mapperoni and uMap let you create maps with layers in a minute, embed them in your site or share them with others to contribute. An example: The urban design office prostorož invited citizens of Ljubljana in 2020 to vote for locations they experience as hot. In three weeks, they cast around 700 votes. The data was consistent with the locations of heat islands measured by satellite thermal imaging. The responses showed that people change routes and habits in the summer or avoid certain locations in the city altogether due to the heat. Respondents also suggested their own cooling measures - they want more and bigger trees, less asphalt, less concrete, and less parking spaces. This map was then published in newspapers and reached a big audience.
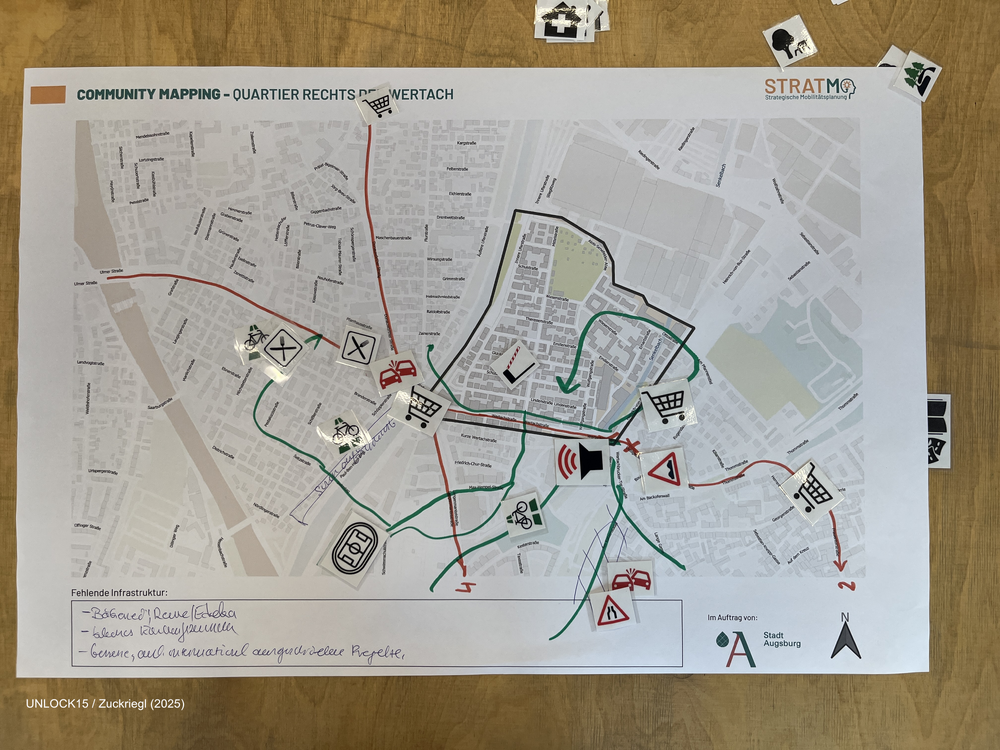
Collaboratively mapping maps about a neighbourhood can shed light on factors that influence everyday transport-related decisions.
more tools for Evidence…
In this category you find tools that help you to create a vision of what you are aiming for. A strong vision is key for driving change because it helps you to grow as a movement and to shift public opinions. This category also includes tools that help you envision how you want to work together as a group.

Communication platforms like slack or discourse have dedicated channels for different projects and teams, keeping discussions focused and easily searchable. On the scale of a small initiative they don't cost anything.
The Five Whys is a simple yet powerful research method from human-centered design. Starting with a broad question about a person's habits or behaviours, you ask "why" five times in a row — not horizontally ("why else?") but vertically, going deeper with each answer until you uncover the emotional and human roots of a problem. The method takes only about 15 minutes, requires nothing more than pens and paper, and is designed to get to the core of a person's beliefs and motivations.
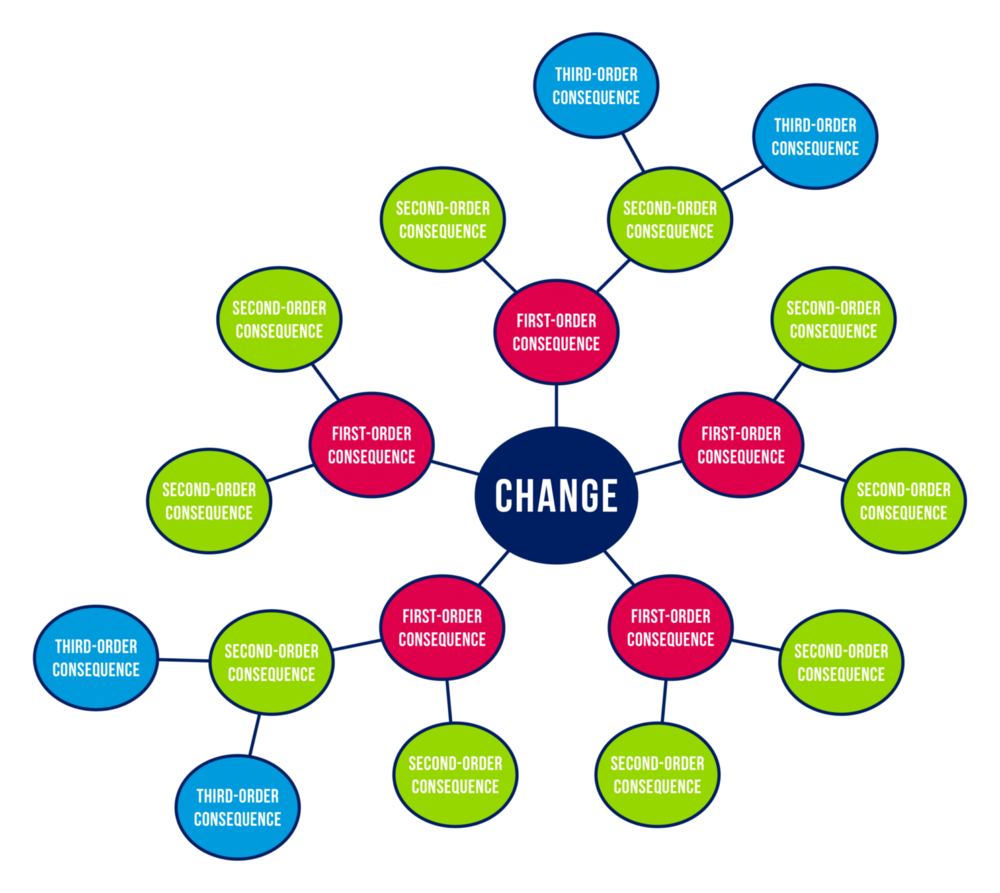
The Futures Wheel is a visual foresight and brainstorming tool invented by American futurist Jerome C. Glenn in 1971, designed to graphically map the primary, secondary, and tertiary consequences of a specific event, trend, or change using a circular diagram with concentric rings radiating from a central hub.
The method works by placing a central change or issue at the core of the diagram — for example, a new policy, a social trend, or a strategic decision — and then working outward in layers. The first ring captures direct, first-order consequences; from each of those, a second ring of second-order consequences is generated, and so on — surfacing implications beyond the immediate and obvious, and helping develop an understanding of causality through ripple effects.
more tools for Vision…
Small steps towards the realisation of local change can help to make the vision tangible and also easier to be discussed. Tools for action help to make the impact of change tangible and involve local communities.

The Place Mobil is a cargo bike that takes up two parking spaces when unfolded. However, as it is officially classified as a bicycle, it can be parked anywhere in public spaces (including parking lots) free of charge and legally.
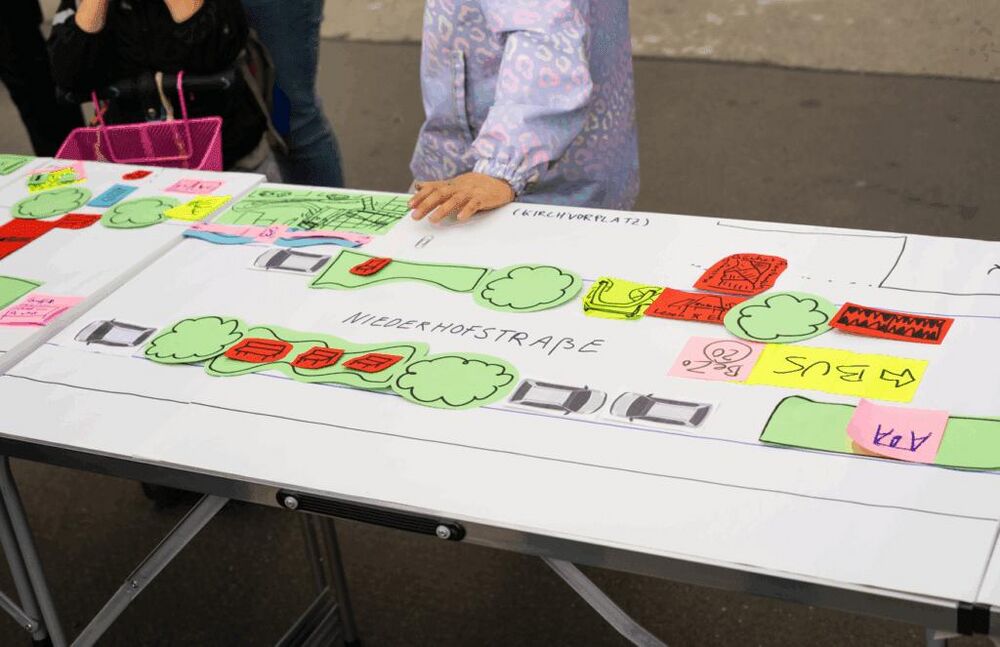
By setting up a table in the street, a big print of the layout of your street and pens you can provide a fun way to develop ideas for greening, traffic calming and street furniture. You could discuss with passers-by what uses they would like to see, what space is needed for them, and what ideas they can come up with. From a simple cycle path to a vibrant street park! If you live in Vienna, the platform WirMachenWien can assist and do the workshop with you.
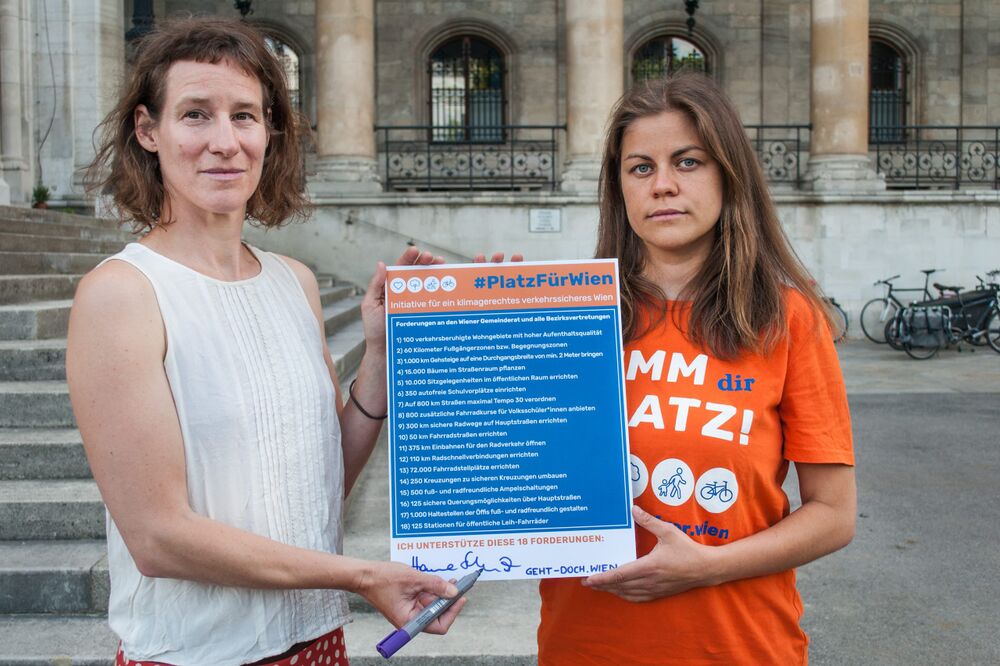
The "Platz für Wien" Initiative had a lasting impact on Vienna because they specified their demands and backed them up with scientific findings (e.g., demand for 50 km of bicycle lanes by 2030). They even has scientists speaking up for them, which made their demands even more valid.
more tools for Action…