No edit summary |
No edit summary |
||
| (4 intermediate revisions by the same user not shown) | |||
| Line 1: | Line 1: | ||
{{#semorg-overview:toolbox | |||
| | |list intro=All tools with a focus on: [[Evidence]] / [[Vision]] / [[Action]] | ||
|filter links=toolbox-tool-type,toolbox-language,toolbox-spatial-context,toolbox-effort-level,toolbox- | |filter links=toolbox-tool-type,toolbox-language,toolbox-spatial-context,toolbox-effort-level,toolbox-spatial-limitation,toolbox-target-group | ||
|card template=toolbox | |card template=toolbox | ||
|nopagination | |nopagination | ||
|limit=100 | |||
}} | }} | ||
Latest revision as of 10:21, 23 June 2026
15min-City online Maps

Align on Your Impact Goals
Art Spin bike tour

Bikebus

Building durable groups with low hierachies
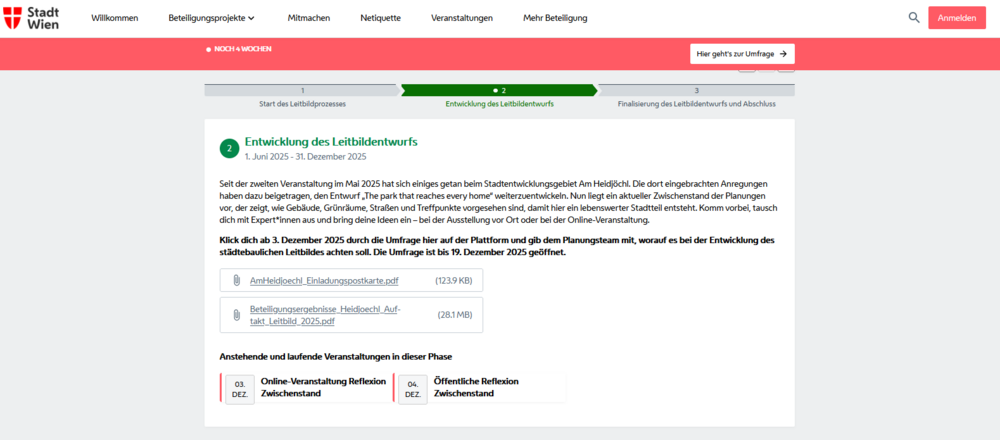
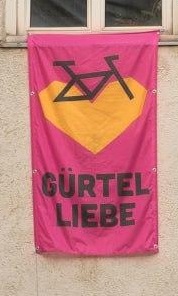
Centralized participation plattform
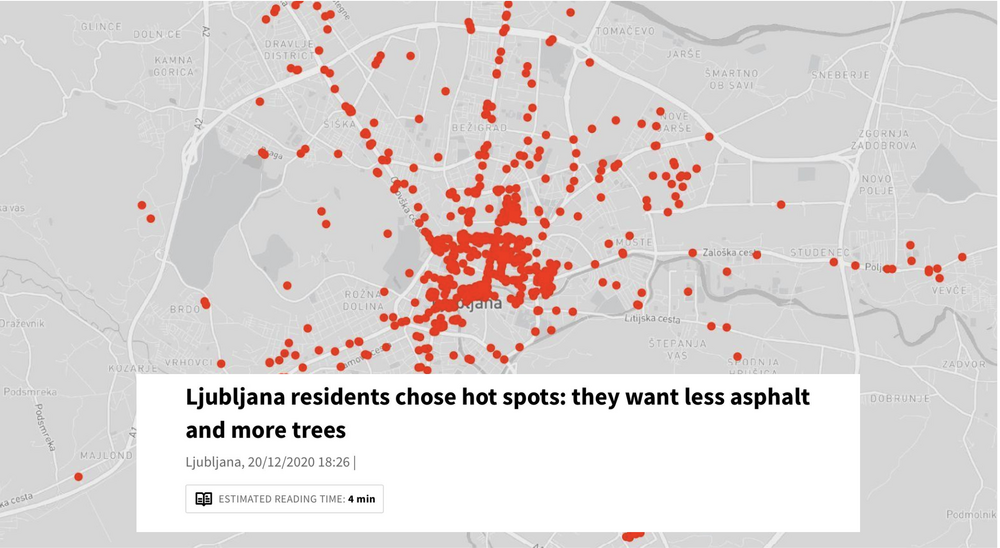
Collaborative heat maps
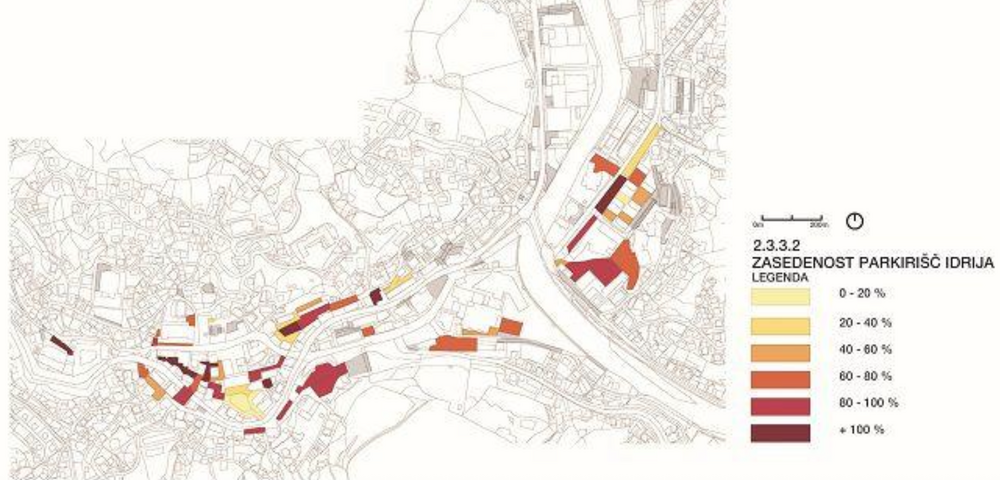
Collecting data about parking occupancy
Opponents of street transformation often claim, that there are to little parking possibilities. But is that true? Evidence in Ljubljana showed that the city has rather a problem with how parking space is unevenly occupied. The urban design studio prostorož suggested the following steps to collect data about parking space occupancy.
- define the area of observation (street / block / neighbourhood)
- prepare the site plan of all the parking spots you will observe / have access to, regardless of ownership
- set a hypothesis (e.g. parking is occupied by employees, not generating income for local shops)
- create an observation plan: check occupancy one Wednesday and Saturday; and granular occupancy of observed parking lots every 2 hours, starting from 5 AM to 12:00 PM
- graphically present data for example via Q-GIS and interpret results
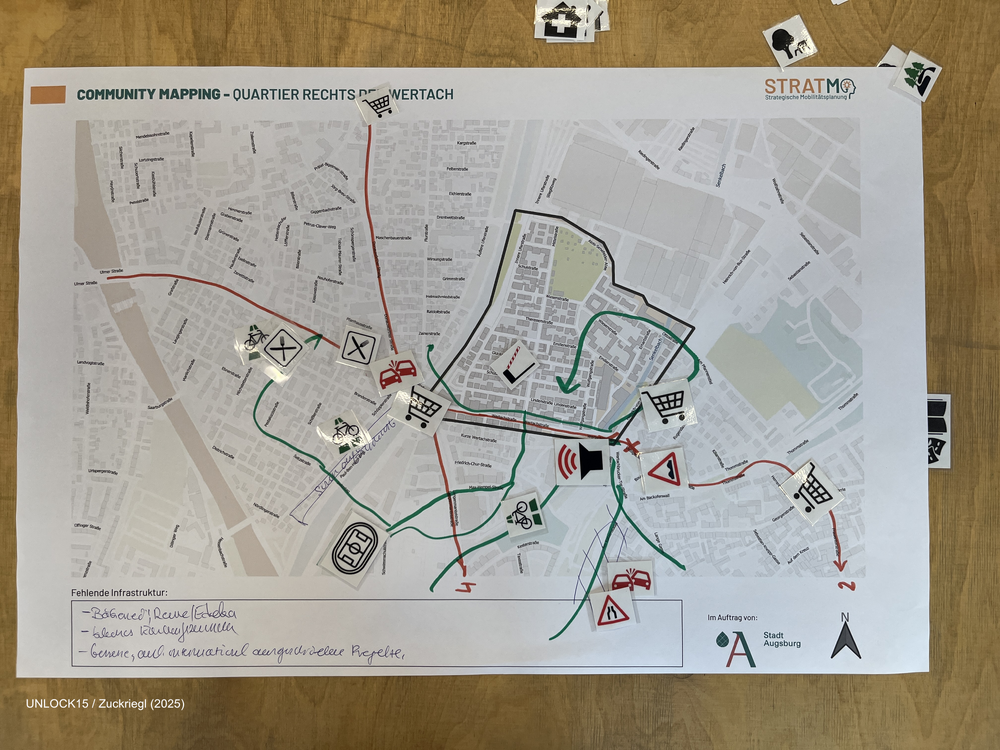
Community mapping

Creating a team culture

Crosswalk action

Crowd Funding
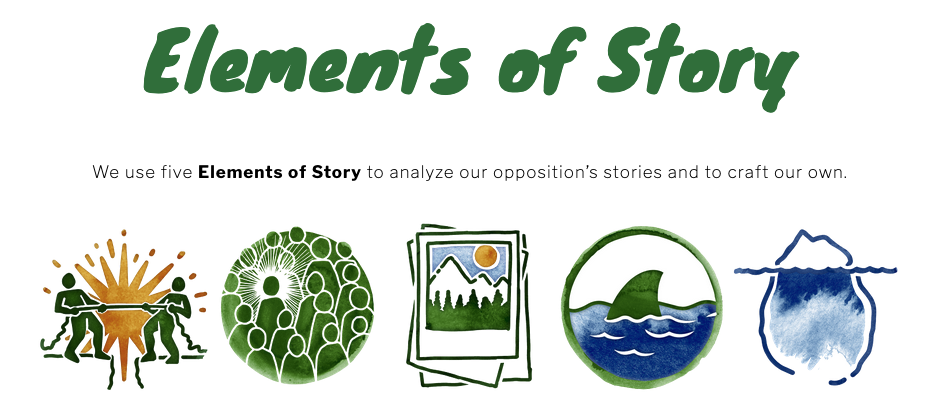
Developing a convincing story for your campaign

Efficient decision making in low hierarchy settings
Forecasting change
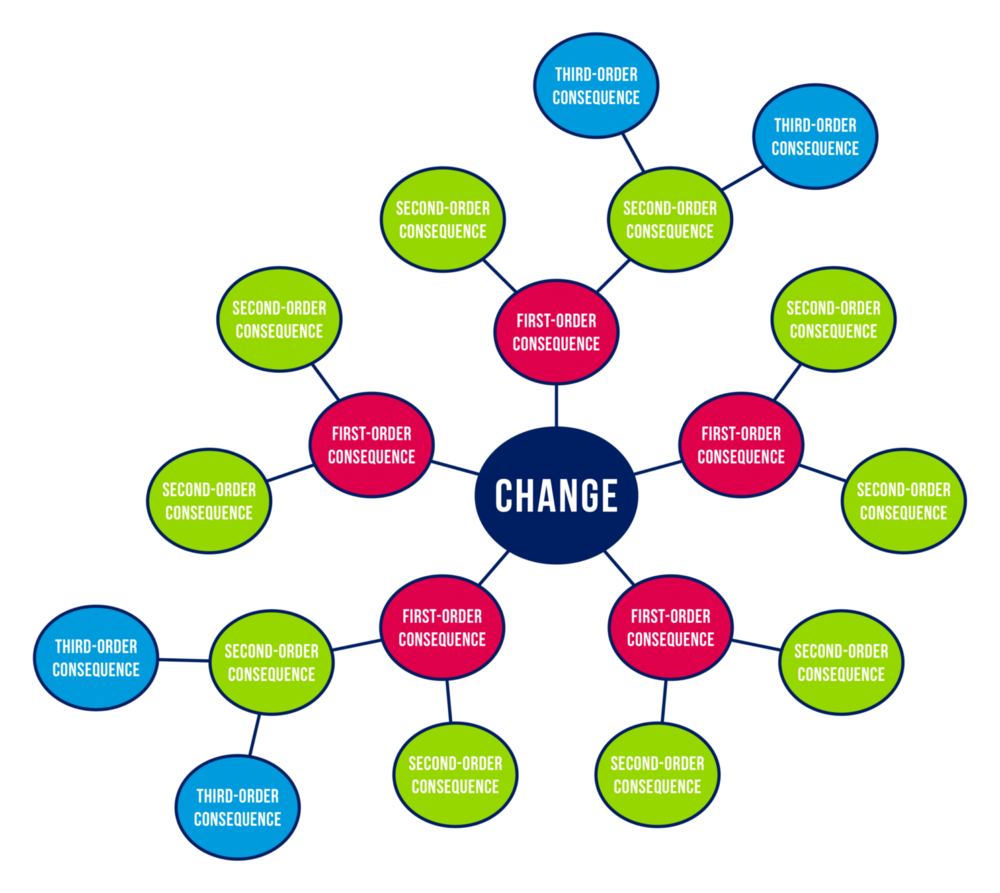
The Futures Wheel is a visual foresight and brainstorming tool invented by American futurist Jerome C. Glenn in 1971, designed to graphically map the primary, secondary, and tertiary consequences of a specific event, trend, or change using a circular diagram with concentric rings radiating from a central hub.
The method works by placing a central change or issue at the core of the diagram — for example, a new policy, a social trend, or a strategic decision — and then working outward in layers. The first ring captures direct, first-order consequences; from each of those, a second ring of second-order consequences is generated, and so on — surfacing implications beyond the immediate and obvious, and helping develop an understanding of causality through ripple effects.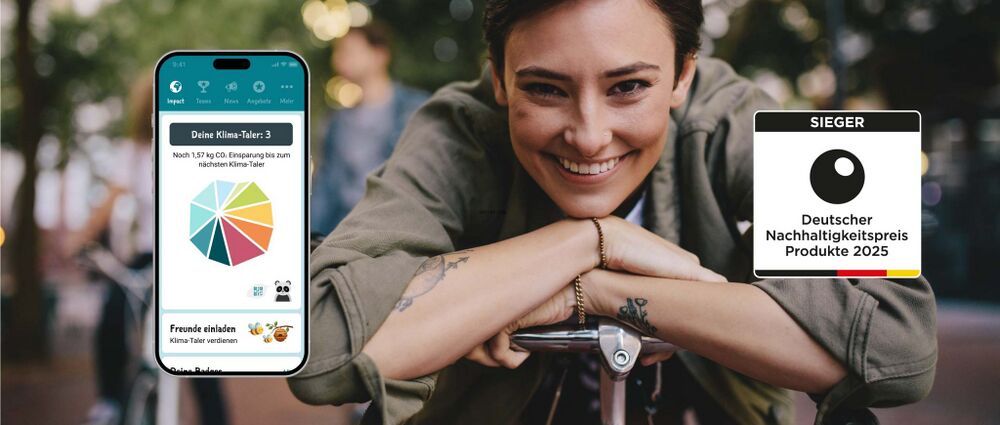
Gamification of climate friendly behaviour

Getting to the core of human behaviour

Headlines from the future
Human pop up bike lane
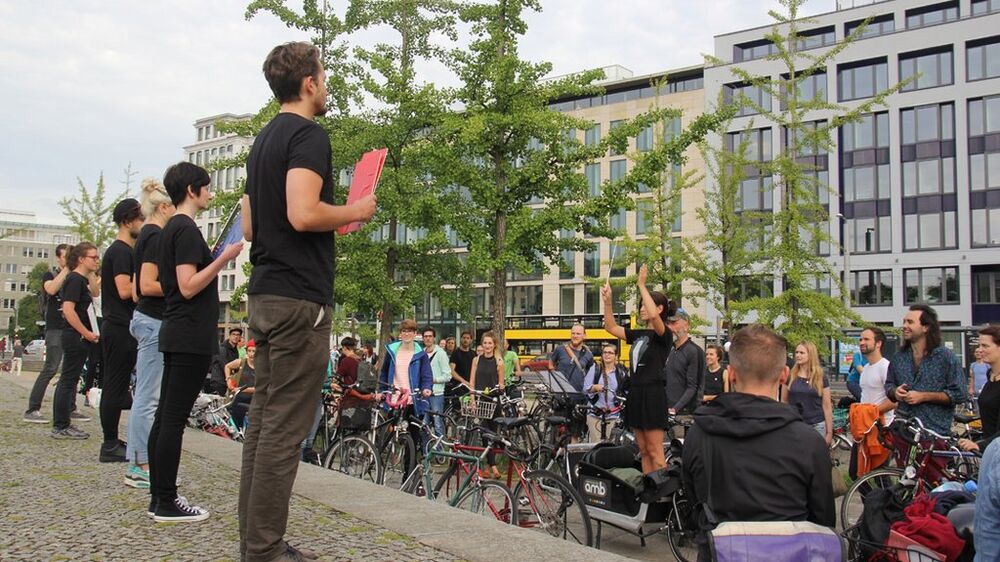
Joint Survey between initiatives and district politics
A joint survey between district politics and initiatives has potential to drive change. A survey means to ask inhabitants of an area what they like or don't like about status quo and what they want to change. The initiative has local knowledge of the area and knows what is important to ask. The survey results give politicans guidance what kind of change is backed up by the inhabitants. From our experience a joint survey is possible when
- all involved people are amicable towards each other
- there is a third neutral party (for example science project or neighbourhood management) that coordinates the process

Learning public participation hub

Local project advisory board
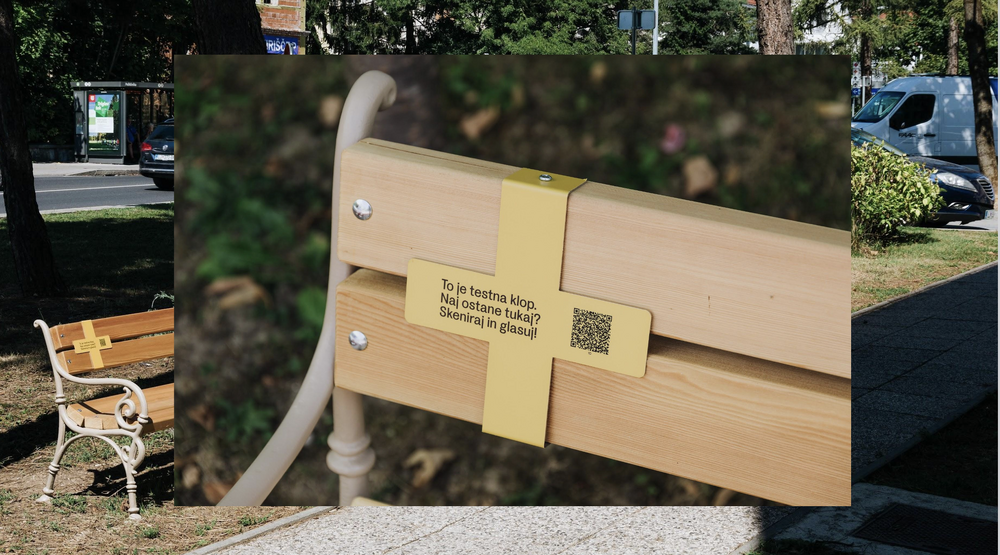
Low effort survey in public space
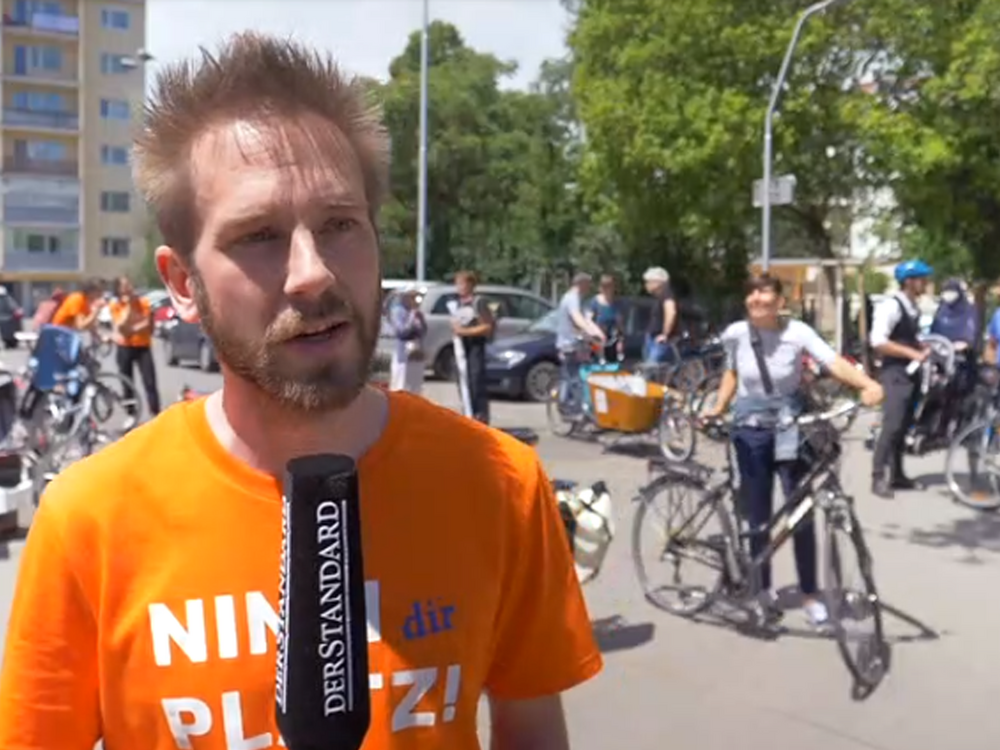
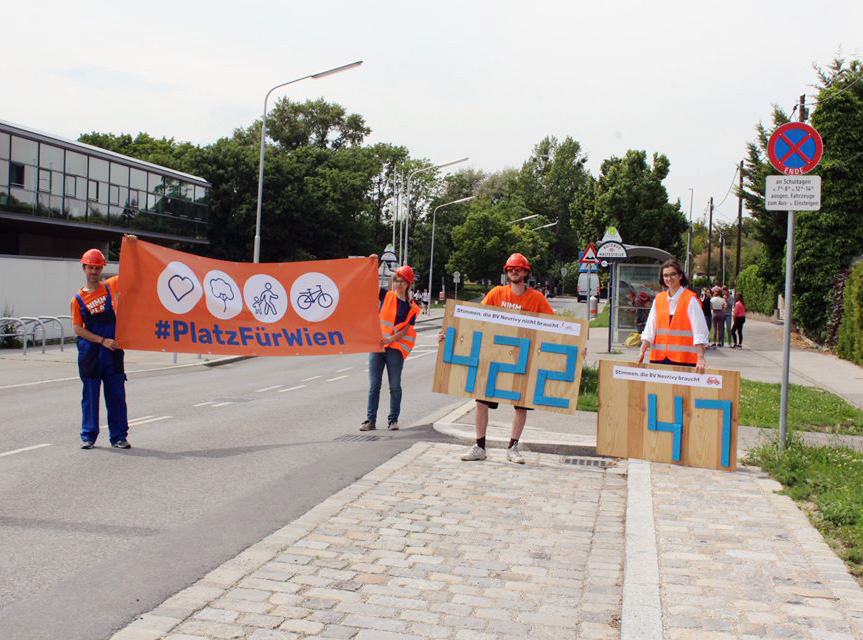
The picture stems from Ljubljana, where the urban design studio prostorož set up benches in public space. They attached a QR-Code, where people could vote if they wanted this bench to stay. In a short period of time about 400 people voted, that they would like the bench to stay because they frequently use it. On this basis prostorož talked to the people in charge of that area. The survey was enough evidence for them to let the benches stay! What a success!
In case this inspires you to take action: Make sure that the QR-code is made out of solid material, that endures the time you want the survey to last. The tool material link will lead you to a website where different survey tools are offered, a lot of them without additional costs.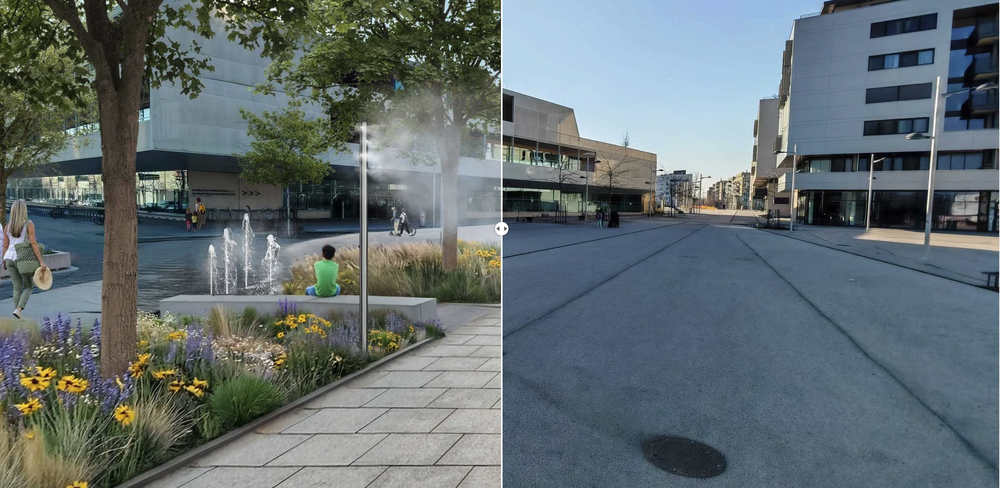
Make your city bloom! Before/After Visualization
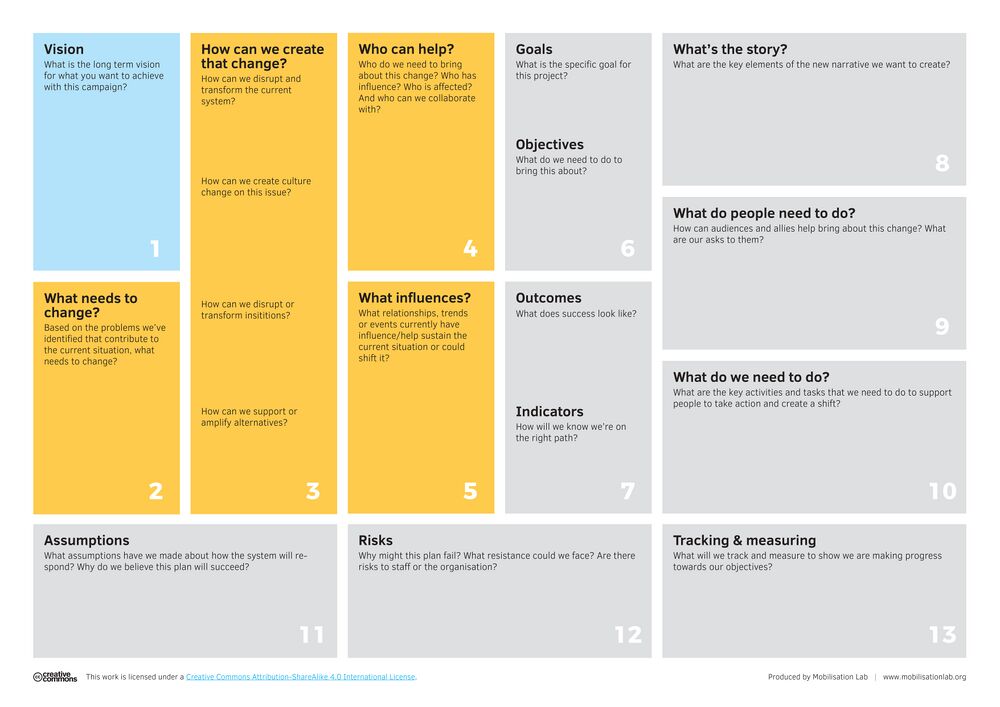
Make your vision achievable with a Campaign plan
Making processes in public administration more transparent
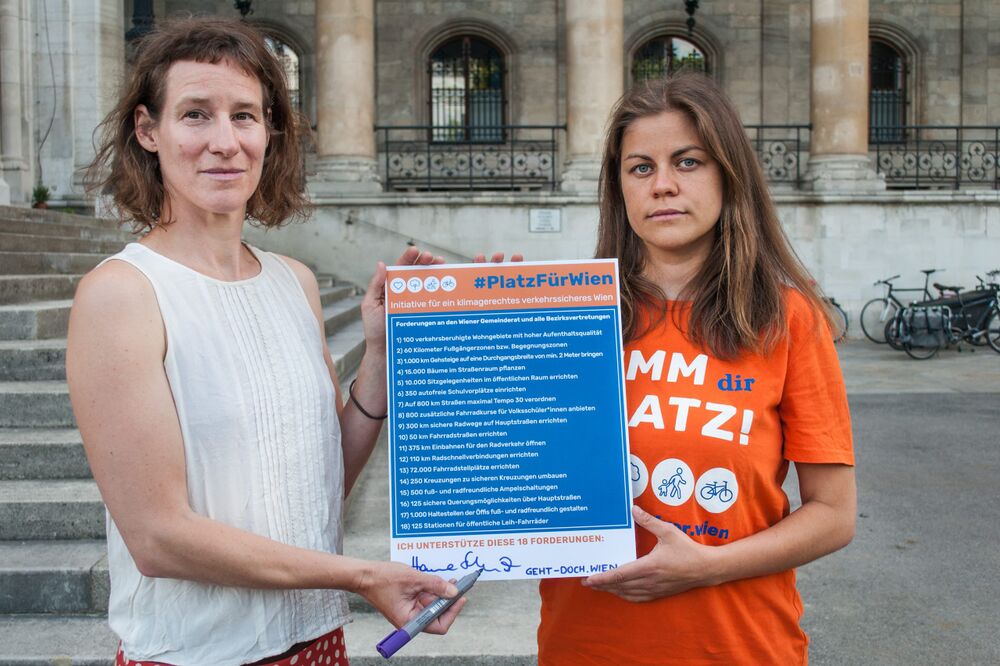
Making specific demands that are backed up by evidence
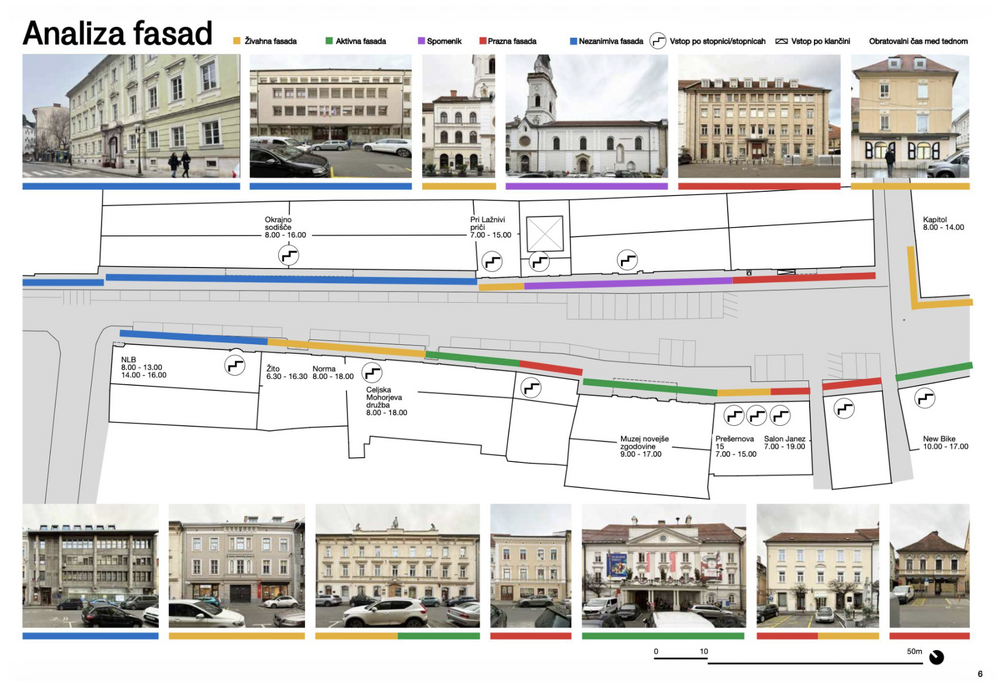
Mapping and analysing facades
"We need parking space otherwise our shops will die!" This is an argument often brought forward by opponents of street transformation. The urban design studio prostorož confronted this claim with evidence. They analysed the facades of the street by the following categories: Lively facade, active facade, monument, empty facade, unremarkable facade. They could show that a lot of the ground floor was at that point in time not occupied.
prostorož combined this analysis with analysing parking place occupancy and human behaviour to build an even stronger argument: A street full of cars is not helping shops at the moment. By combining all these analysis they managed to convince the decision makers to give that street a human friendly makeover!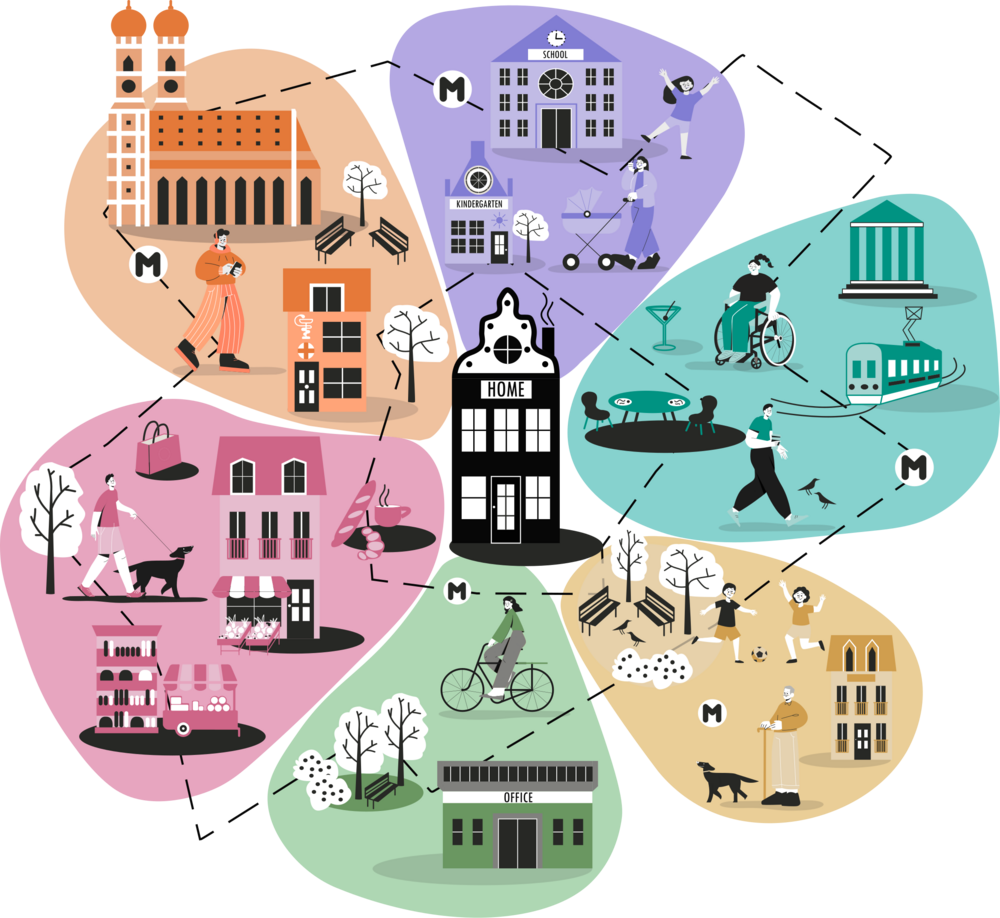
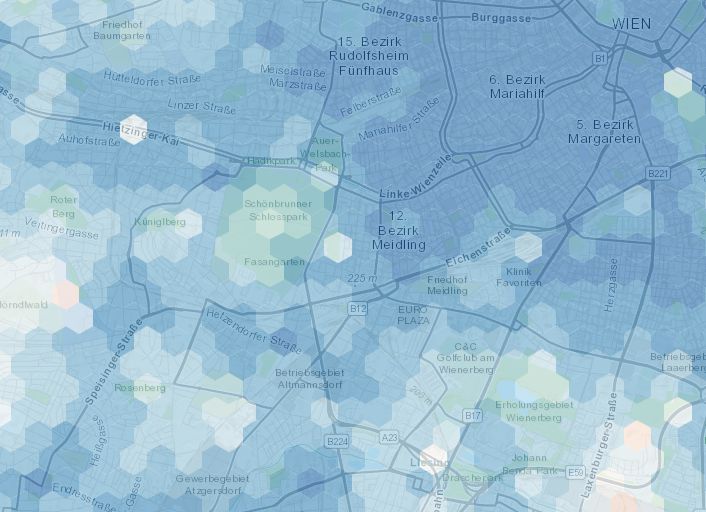
Measuring the 15-min city: Flowers of Proximity
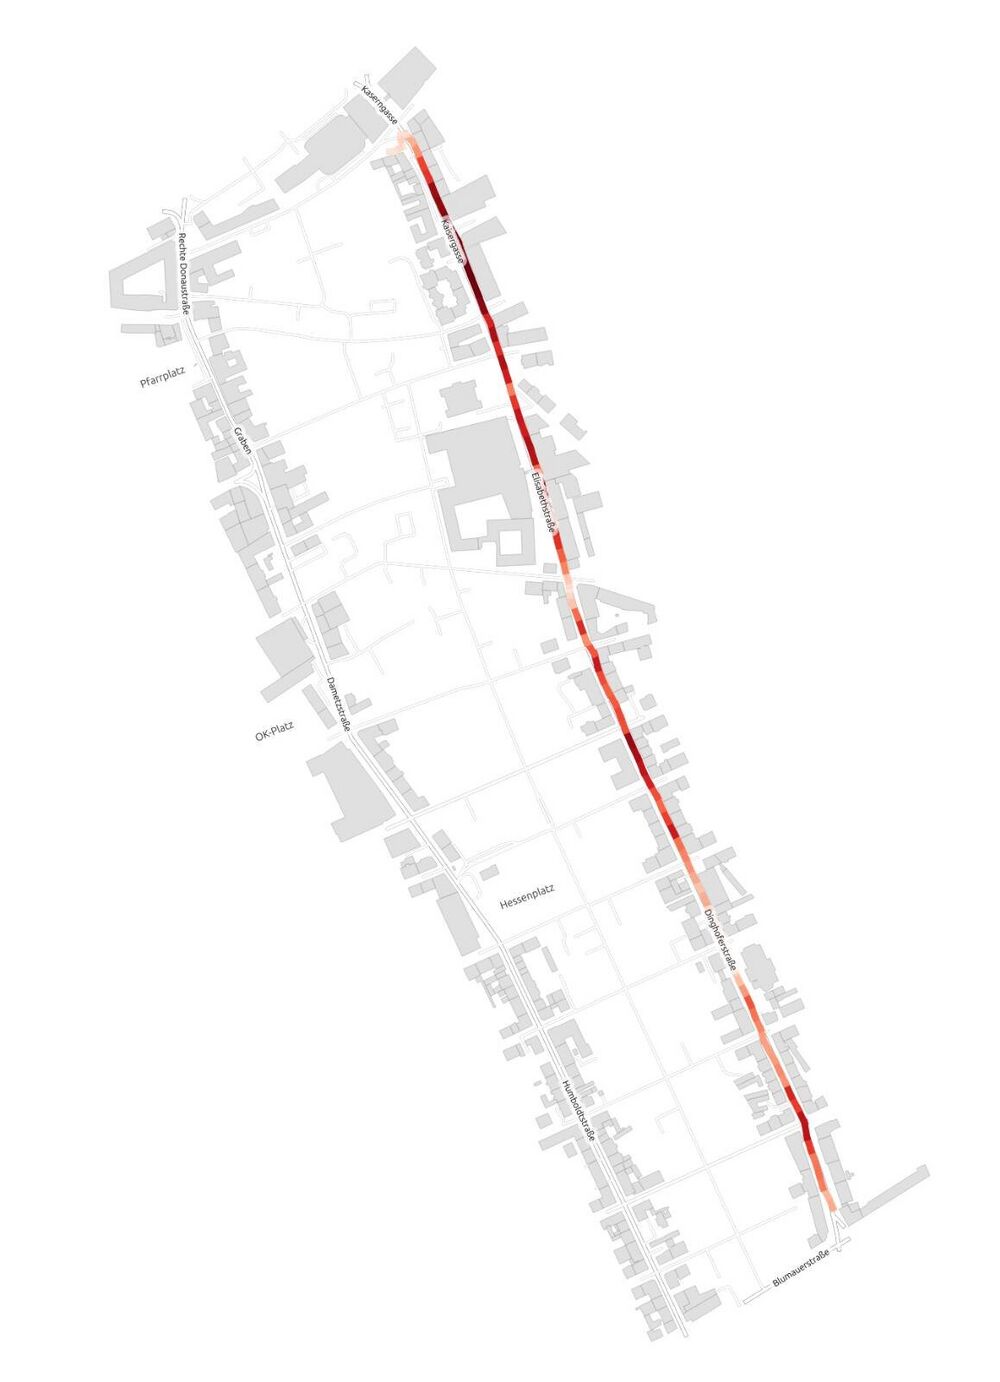
Measuring the speed of public transport
"We can’t reduce the speed limit on this road because the busses would loose time!“ This or similar arguments may come up in discussions about street transformations. In those situations, it can help to bring evidence into the discussion. For example by measuring the speed of busses. Think in advance how to make your data collection as valid as possible within your ressources. To produce solid evidence about the speed of public transport we suggest the following steps:
- Make a plan how you will collect your data: What do you want to measure (one busline in both directions between bus stop X and Y), when (on peak/off peak, which days) and how often (how many times per day)
- Install an App that collects GPX-Tracks (data that links speed with location)
- Ride the busses according to your data collection plan
- Find someone who knows how to use QGIS (open source program for making maps) and install the plug-in for GPX Segment importer (https://plugins.qgis.org/plugins/GpxSegmentImporter/#plugin-about)
- If everything works out the result should be maps like the ones you see here.
- Think about how you want to communicate the data: In a confidential setting or rather to a bigger audience?
New local collaborations to boost change!
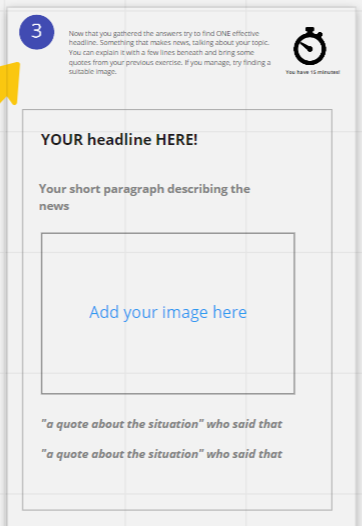
Newspaper of Tomorrow
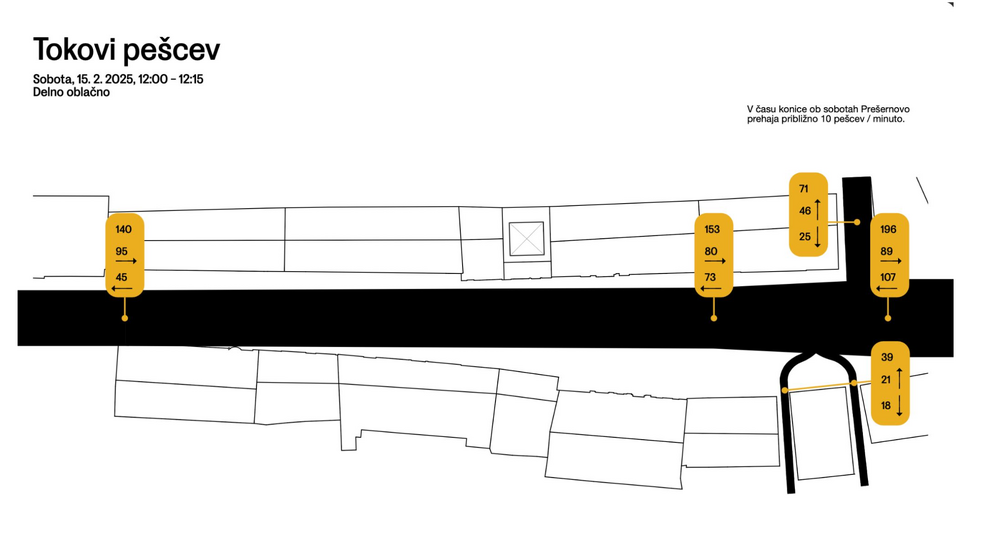
Observing and visualising human behaviour in public space

Onboarding framework
The Onboarding Framework is a structured yet flexible tool designed to help grassroots civil society initiatives welcome and integrate new volunteers with as little friction as possible.
The framework helps initiatives answer three core questions: What does a new volunteer need to know, feel, and do to get started? Where do their skills and interests fit best? And how can the organization make that first step feel easy, welcoming, and worthwhile?
By providing a clear path from curiosity to commitment, the Onboarding Framework reduces dropout at the earliest stage, builds a sense of belonging from day one, and ensures that volunteer energy is channeled effectively — strengthening the initiative's capacity from the bottom up.
Petition: Collect signatures to back up your local vision!

Placemobil - Tactical Urbanism
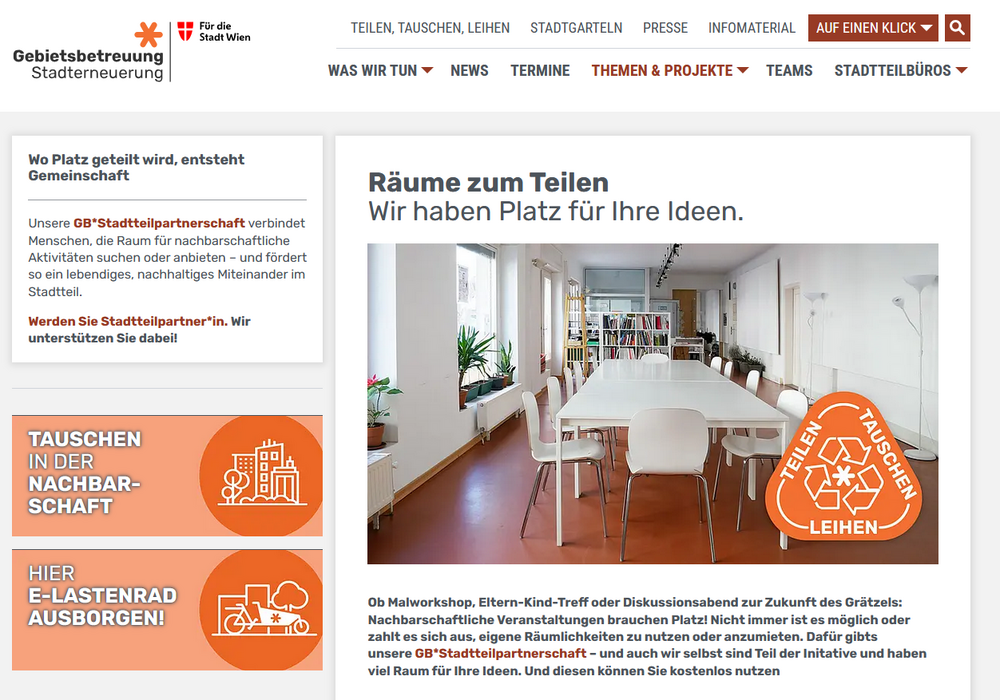
Platform for free meeting spaces

Plenary for sharing emotions
A plenary for emotions is a structured group format that creates dedicated space for emotions and interpersonal dynamics within a collective or initiative — separate from task-oriented or decision-making meetings. Rather than pushing emotions to the margins of group life, the Emo-Plenum treats them as essential information: a signal about the health, motivation, and tensions within the group.
It is recommended to have a person that facilitates the plenary. This means guiding through the structure and keeping an eye on the time. This is how a Plenary of Emotions can be structured:
- Round: Each person expresses how they feel. In regards to the group but also in general. Resist the temptation to react to what has already been said and focus on yourself. The round is finished when everybody has shared something.
- Round: In the same order as before people can react to what has been said by others. The focus lies on validating and relating to emotions of others not jumping into problem solving mode right away. The round can go as long as people have to say something.
- Round: Collect next steps from what has been said. This can happen but doesn't have to.
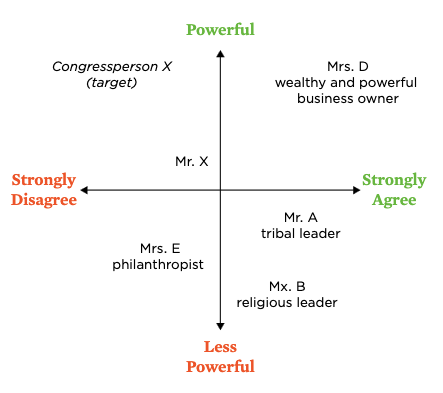
Power Mapping
Presswork to spread your vision
Public Engagement Onion
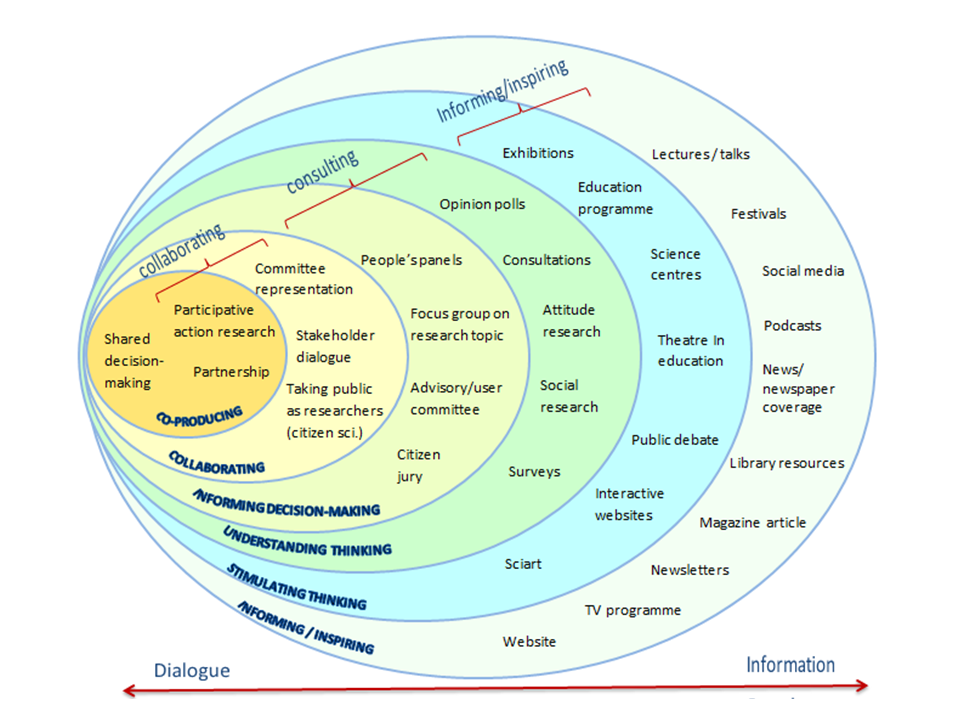
The Public Engagement Onion is a visual framework originally developed by the Wellcome Trust that maps the different levels and forms of public engagement — from broad, one-directional communication to deep, two-way collaboration.
Like the layers of an onion, the model moves from the outside in: the outer layers represent activities such as broadcasting information or raising awareness, where the engagement is relatively wide-reaching but shallow. Moving toward the center, activities become more interactive and participatory, culminating in shared decision-making and co-creation at the core.
Regulars table for district politics and initiatives
Staging evidence for safer school streets
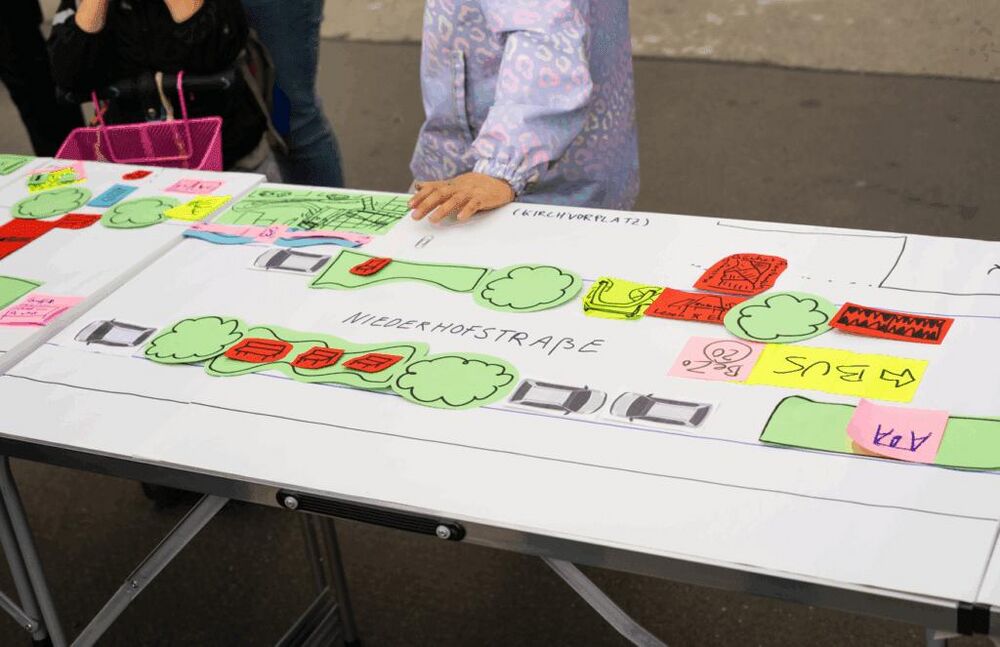
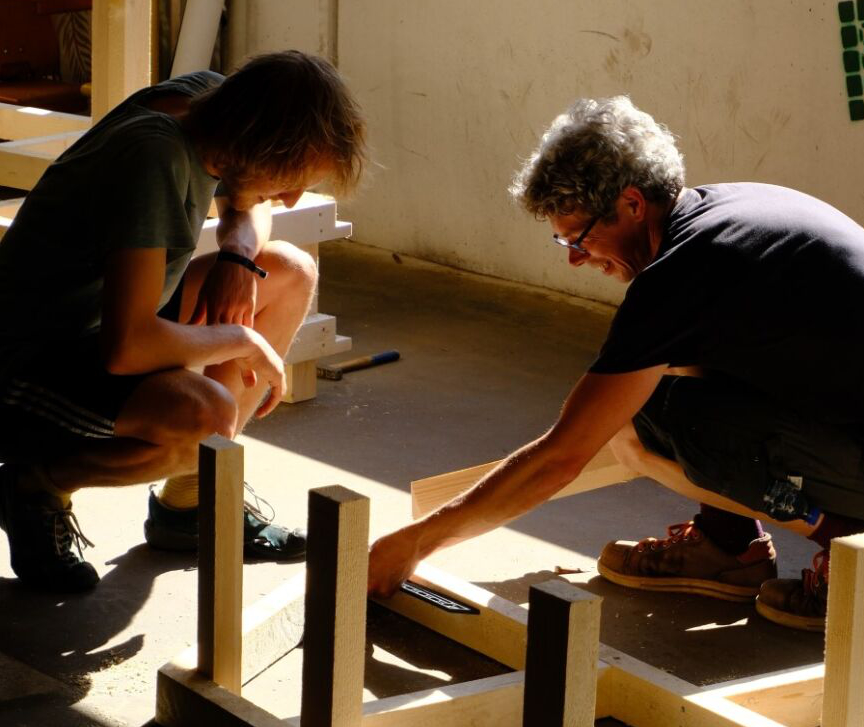
Streetdesign table
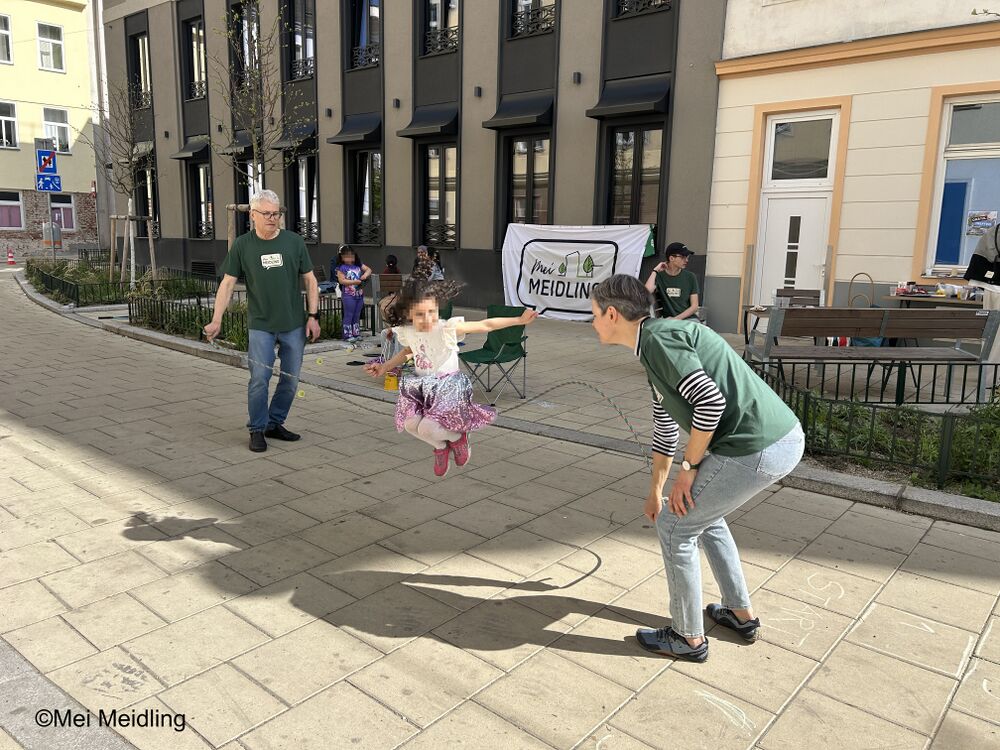
Streetgames

Task & Maintenance: What makes groups work?
Tools to help communicate within a group

Tree Budget Graz
Understanding your target groups